
Page 78 - Decision Making Applications in Modern Power Systems
P. 78
Uncertainty management in decision-making Chapter | 2 49
The MCS generates a high number of scenarios subject to the Weibull
distribution, each of which is assigned a probability value that is equal to 1
divided by the number of generated scenarios [37]. In each scenario a ran-
dom value for the wind speed is considered for the current hour. According
to the assigned PDF, in each scenario, the hourly random wind speed is gen-
erated; therefore, according to the random wind speed, WT power generation
is calculated as
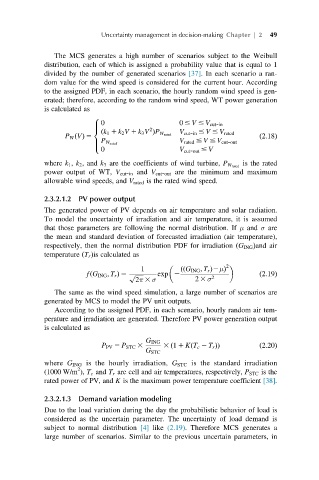
8
0
> 0 # V # V cut-in
2
>
<
P W ðVÞ 5 ðk 1 1 k 2 V 1 k 3 V ÞP W rated V cut-in # V # V rated ð2:18Þ
V rated # V # V cut-out
P W rated
>
>
0 V cut-out # V
:
is the rated
where k 1 , k 2 , and k 3 are the coefficients of wind turbine, P W rated
power output of WT, V cut-in and V cut-out are the minimum and maximum
allowable wind speeds, and V rated is the rated wind speed.
2.3.2.1.2 PV power output
The generated power of PV depends on air temperature and solar radiation.
To model the uncertainty of irradiation and air temperature, it is assumed
that those parameters are following the normal distribution. If μ and σ are
the mean and standard deviation of forecasted irradiation (air temperature),
respectively, then the normal distribution PDF for irradiation G ING Þand air
ð
ðÞis calculated as
temperature T r
1 ððG ING ; T r Þ2μÞ 2
fðG ING ; T r Þ 5 p ffiffiffiffiffiffi exp 2 ð2:19Þ
2π 3 σ 2 3 σ 2
The same as the wind speed simulation, a large number of scenarios are
generated by MCS to model the PV unit outputs.
According to the assigned PDF, in each scenario, hourly random air tem-
perature and irradiation are generated. Therefore PV power generation output
is calculated as
G ING
P PV 5 P STC 3 3 1 1 KðT c 2 T r ÞÞ ð2:20Þ
ð
G STC
where G ING is the hourly irradiation, G STC is the standard irradiation
2
(1000 W/m ), T c and T r are cell and air temperatures, respectively, P STC is the
rated power of PV, and K is the maximum power temperature coefficient [38].
2.3.2.1.3 Demand variation modeling
Due to the load variation during the day the probabilistic behavior of load is
considered as the uncertain parameter. The uncertainty of load demand is
subject to normal distribution [4] like (2.19). Therefore MCS generates a
large number of scenarios. Similar to the previous uncertain parameters, in