
Page 335 - Design for Environment A Guide to Sustainable Product Development
P. 335
310 Cha pte r Se v e ntee n
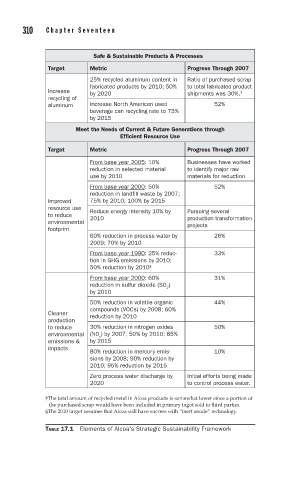
Safe & Sustainable Products & Processes
Target Metric Progress Through 2007
25% recycled aluminum content in Ratio of purchased scrap
fabricated products by 2010; 50% to total fabricated product
Increase
by 2020 shipments was 30%. ‡
recycling of
aluminum Increase North American used 52%
beverage can recycling rate to 75%
by 2015
Meet the Needs of Current & Future Generations through
Efficient Resource Use
Target Metric Progress Through 2007
From base year 2005: 10% Businesses have worked
reduction in selected material to identify major raw
use by 2010 materials for reduction
From base year 2000: 50% 52%
reduction in landfill waste by 2007;
Improved 75% by 2010; 100% by 2015
resource use Reduce energy intensity 10% by Pursuing several
to reduce 2010 production transformation
environmental
projects
footprint
60% reduction in process water by 26%
2009; 70% by 2010
From base year 1990: 25% reduc- 33%
tion in GHG emissions by 2010;
50% reduction by 2010 §
From base year 2000: 60% 31%
reduction in sulfur dioxide (SO )
2
by 2010
50% reduction in volatile organic 44%
compounds (VOCs) by 2008; 60%
Cleaner
reduction by 2010
production
to reduce 30% reduction in nitrogen oxides 50%
environmental (NO ) by 2007; 50% by 2010; 85%
x
emissions & by 2015
impacts
80% reduction in mercury emis- 10%
sions by 2008; 90% reduction by
2010; 95% reduction by 2015
Zero process water discharge by Initial efforts being made
2020 to control process water.
‡The total amount of recycled metal in Alcoa products is somewhat lower since a portion of
the purchased scrap would have been included in primary ingot sold to third parties.
§The 2010 target assumes that Alcoa will have success with “inert anode” technology.
TABLE 17.1 Elements of Alcoa's Strategic Sustainability Framework