
Page 264 - Design for Six Sigma a Roadmap for Product Development
P. 264
234 Chapter Seven
Direction of Improvement % of Employees Trained Close the Deal Cycle Time Prospecting Cycle Time
Direction of Improvement Use of Standardized Documents and Tools Updating of Customer Account Data Importance of the Part Attributes Relative Importance of Part Attributes
Maximize 1.0 Discovery Cycle Time
Target 0.0 Systems Uptime Setup Cycle Time Target Values
Minimize –1.0
1 1 2 3 4 5 6 7 8 1 2 3
Direction of Improvement 1
First Call Resolution % 1 5103.0 15.8 = 80% First Call Resolution 1
% Svc. Req. Res. by Promise Date 2 5004.0 15.5 100% of Service Requests Resolved by Promise Date 2
% Total Portfolio Reviewed/Year 3 4266.0 13.2 10% 3
% Discovery Document Complete 4 3618.0 11.2 100% 4
Sales Cycle Time 5 1911.0 5.9 60 Days 5
Customer Satisfaction Rating 6 3927.0 12.1 6
% AM/CSAs >= 2 Competency Model 7 3159.0 9.8 80% 7
Average Speed of Answer 8 1278.0 4.0 80% of Calls Answered in < 24 Seconds 8
Losses Due to Price 9 1356.0 4.2 < 10% 9
% CSAs >= 27 Call Coaching 10 2718.0 8.4 80% 10
647.7 590.3 483.3 443.7 202.9
Importance of Process Attributes 1 89.6 89.6 53.2
Used 90% of the Time 22.7 95% System Update Moderate 3.0
Relative Importance of Process Attributes 2 24.9 18.6 17.1 7.8 3.4 3.4 2.0 Standard 9-3-1
Target Values 3 Strong 9.0
Weak
1.0
100% Nightly Update 10 Days 45 Days 12 Days 5 Days
1 2 3 4 5 6 7 8
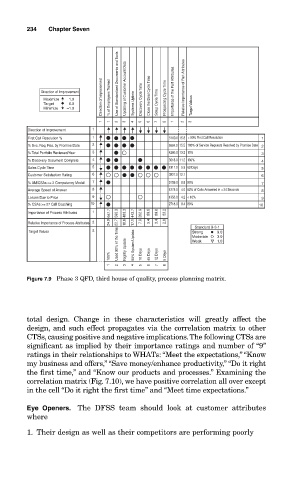
Figure 7.9 Phase 3 QFD, third house of quality, process planning matrix.
total design. Change in these characteristics will greatly affect the
design, and such effect propagates via the correlation matrix to other
CTSs, causing positive and negative implications.The following CTSs are
significant as implied by their importance ratings and number of “9”
ratings in their relationships to WHATs: “Meet the expectations,” “Know
my business and offers,” “Save money/enhance productivity,” “Do it right
the first time,” and “Know our products and processes.” Examining the
correlation matrix (Fig. 7.10), we have positive correlation all over except
in the cell “Do it right the first time” and “Meet time expectations.”
Eye Openers. The DFSS team should look at customer attributes
where
1. Their design as well as their competitors are performing poorly