
Page 408 - Design of Simple and Robust Process Plants
P. 408
9.6 Project Methodology for Operation Optimization 395
The validation process contains similar elements for the different validation steps:
± Selection and calibration of plant measurements.
± Development of an experimental design program over the entire operational
range.
± Interpretation of the results.
The different validation steps will partly run in parallel, but ultimately they are exe-
cuted in sequential order.
9.6.12.1 Gross modeling error detection
This is a manual activity and, in principle, all deviations except for measurement
errors are modeling errors. Measurement errors are detected by evaluation of its
location (is it really located at place it is supposed to be?)and calibration (specifically
for the validation). For validation, specific samples might be taken and analyzed on
composition to confirm certain critical process streams. The ultimate effort is to
minimize the square of the deviations between simulated and actual measurements.
The focus in this step is on improvement of the process model after verification of
the instruments.
The unit operation models include reactor models which have already been veri-
fied during the model building, and should be revalidated first. This is particularly
so as the steady-state detection and data reconciliation and DR&PE modules are
now operational. This makes it possible to achieve a better basis for comparison.
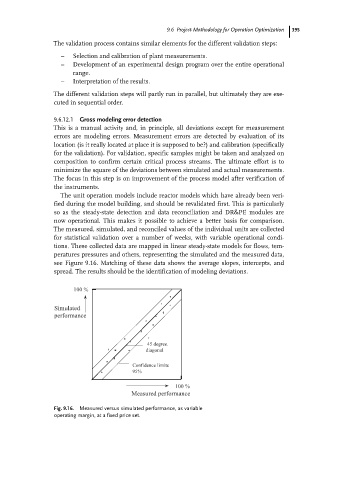
The measured, simulated, and reconciled values of the individual units are collected
for statistical validation over a number of weeks, with variable operational condi-
tions. These collected data are mapped in linear steady-state models for flows, tem-
peratures pressures and others, representing the simulated and the measured data,
see Figure 9.16. Matching of these data shows the average slopes, intercepts, and
spread. The results should be the identification of modeling deviations.
100 %
Simulated
performance
45 degree.
diagonal
Confidence limits
95%
100 %
Measured performance
Fig. 9.16. Measured versus simulated performance, as variable
operating margin, at a fixed price set.