
Page 115 - Design of Solar Thermal Power Plants
P. 115
102 2. THE SOLAR RESOURCE AND METEOROLOGICAL PARAMETERS
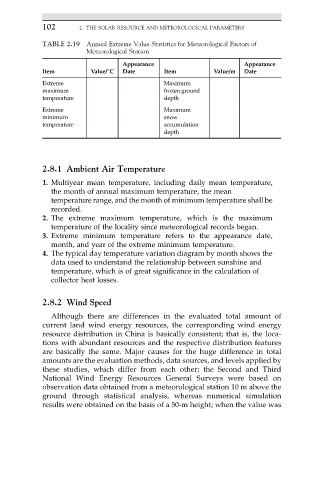
TABLE 2.19 Annual Extreme Value Statistics for Meteorological Factors of
Meteorological Station
Appearance Appearance
Item Value/ C Date Item Value/m Date
Extreme Maximum
maximum frozen ground
temperature depth
Extreme Maximum
minimum snow
temperature accumulation
depth
2.8.1 Ambient Air Temperature
1. Multiyear mean temperature, including daily mean temperature,
the month of annual maximum temperature, the mean
temperature range, and the month of minimum temperature shall be
recorded.
2. The extreme maximum temperature, which is the maximum
temperature of the locality since meteorological records began.
3. Extreme minimum temperature refers to the appearance date,
month, and year of the extreme minimum temperature.
4. The typical day temperature variation diagram by month shows the
data used to understand the relationship between sunshine and
temperature, which is of great significance in the calculation of
collector heat losses.
2.8.2 Wind Speed
Although there are differences in the evaluated total amount of
current land wind energy resources, the corresponding wind energy
resource distribution in China is basically consistent; that is, the loca-
tions with abundant resources and the respective distribution features
are basically the same. Major causes for the huge difference in total
amounts are the evaluation methods, data sources, and levels applied by
these studies, which differ from each other; the Second and Third
National Wind Energy Resources General Surveys were based on
observation data obtained from a meteorological station 10 m above the
ground through statistical analysis, whereas numerical simulation
results were obtained on the basis of a 50-m height; when the value was