Page 77 - Design of Solar Thermal Power Plants
P. 77

2.5 DISTRIBUTION OF THE SOLAR RESOURCE IN SEVERAL  67
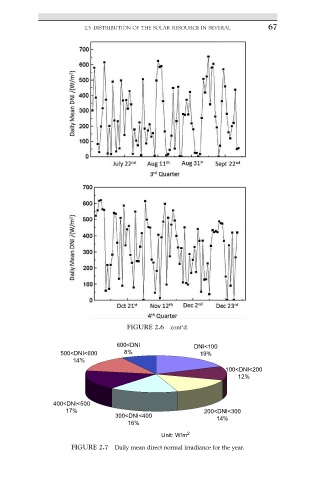


                                   FIGURE 2.6  cont’d.

                                 600<DNI             DNI<100
                 500<DNI<600       8%                  19%
                     14%
                                                              100<DNI<200
                                                                 12%


               400<DNI<500
                   17%                                  200<DNI<300
                                300<DNI<400                 14%
                                    16%
                                             Unit: W/m 2
                    FIGURE 2.7  Daily mean direct normal irradiance for the year.
   72   73   74   75   76   77   78   79   80   81   82