
Page 69 - Designing Autonomous Mobile Robots : Inside the Mindo f an Intellegent Machine
P. 69
Chapter 4
Nominal
PIR
Threat
Contribution
100
T1
T2
80
T0
60
40
20
Ambient Temperature
Degrees Farenheight
20 40 60 80 100 120
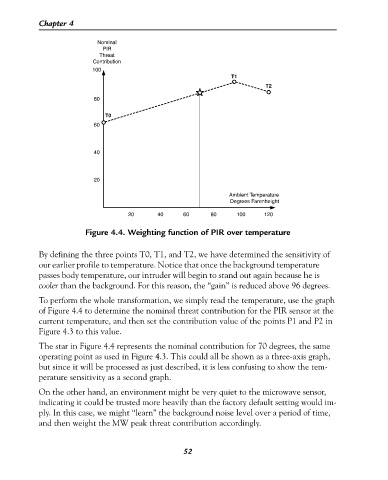
Figure 4.4. Weighting function of PIR over temperature
By defining the three points T0, T1, and T2, we have determined the sensitivity of
our earlier profile to temperature. Notice that once the background temperature
passes body temperature, our intruder will begin to stand out again because he is
cooler than the background. For this reason, the “gain” is reduced above 96 degrees.
To perform the whole transformation, we simply read the temperature, use the graph
of Figure 4.4 to determine the nominal threat contribution for the PIR sensor at the
current temperature, and then set the contribution value of the points P1 and P2 in
Figure 4.3 to this value.
The star in Figure 4.4 represents the nominal contribution for 70 degrees, the same
operating point as used in Figure 4.3. This could all be shown as a three-axis graph,
but since it will be processed as just described, it is less confusing to show the tem-
perature sensitivity as a second graph.
On the other hand, an environment might be very quiet to the microwave sensor,
indicating it could be trusted more heavily than the factory default setting would im-
ply. In this case, we might “learn” the background noise level over a period of time,
and then weight the MW peak threat contribution accordingly.
52