
Page 214 - Aamir Rehman - Dubai & Co Global Strategies for Doing Business in the Gulf States-McGraw-Hill (2007)
P. 214
196 Dubai & Co.
In this graph, one can see, for example, a strata that represents
the “baby boom” generation of post–World War II births composed
of people now in the age range of 40–59. The number of people in this
generation is significantly larger than in the cohorts immediately
surrounding it: note, for example, the steep difference between the
number of people aged 55–59 and the population aged 60–65. The
60–65-year-olds were born during the war; the 55–59-year-olds were
born immediately thereafter. One can also gather from the graph the
impeding strain on the US Social Security system as the 60–64-year-
old (on the cusp of Social Security eligibility) and 55–59 year old
bands are significantly larger than the bands above them. The largest
single age band in the United States, per Figure 7.3, is ages 40–44.
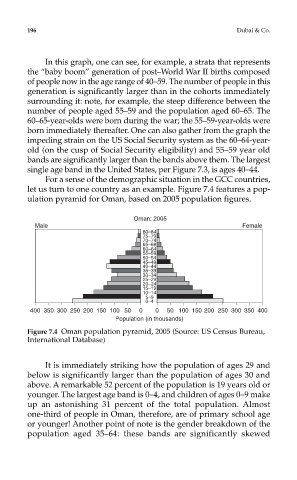
For a sense of the demographic situation in the GCC countries,
let us turn to one country as an example. Figure 7.4 features a pop-
ulation pyramid for Oman, based on 2005 population figures.
Figure 7.4 Oman population pyramid, 2005 (Source: US Census Bureau,
International Database)
It is immediately striking how the population of ages 29 and
below is significantly larger than the population of ages 30 and
above. A remarkable 52 percent of the population is 19 years old or
younger. The largest age band is 0–4, and children of ages 0–9 make
up an astonishing 31 percent of the total population. Almost
one-third of people in Oman, therefore, are of primary school age
or younger! Another point of note is the gender breakdown of the
population aged 35–64: these bands are significantly skewed