
Page 312 - Dust Explosions in the Process Industries
P. 312
Propagation of Flames in Dust Clouds 28 7
- 0.6
< 0.5
-
E
>- 0.4
115
2 c.3
40
CY>
a
2 0.2
110
E! 0.1
0.0
0 100 200 300 400 500
DUST CONCENTRATION [g/dI
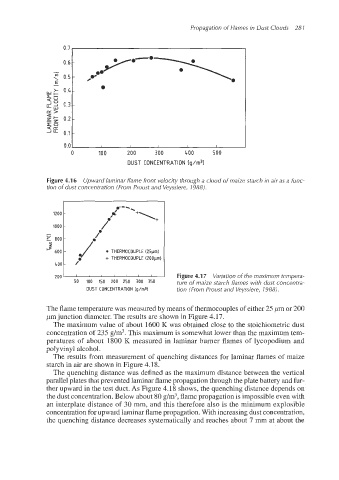
Figure 4.1 6 Upward laminar flame front velocity through a cloud of maize starch in air as a func-
,."'.
tion of dust concentration (From Proust and Veyssiere, 1988).
1200 4
f
1000 / +\+
-
U 6'
e 800
5
* 600 THERMOCOUPLE (25pm)
Ye+ THERMOCOUPLE (200prn)
/*
400
200 I , , , , I , Figure 4.17 Variation of the maximum tempera-
50 100 150 200 250 300 350 ture of maize starch flames with dust concentra-
DUST CONCENTRATION [g/m31 tion (From Proust and Veyssiere, 3988).
The flame temperature was measured by means of thermocouples of either 25 pm or 200
pm junction diameter. The results are shown in Figure 4.17.
The maximum value of about 1600 K was obtained close to the stoichiometric dust
concentration of 235 g/m3.This maximum is somewhat lower than the maximum tem-
peratures of about 1800 K measured in laminar burner flames of lycopodium and
polyvinyl alcohol.
The results from measurement of quenching distances for laminar flames of maize
starch in air are shown in Figure 4.18.
The quenching distance was defined as the maximum distance between the vertical
parallel plates that prevented laminar flame propagation through the plate battery and fur-
ther upward in the test duct. As Figure 4.18 shows, the quenching distance depends on
the dust concentration.Below about 80 g/m3,flame propagationis impossible even with
an interplate distance of 30 mm, and this therefore also is the minimum explosible
concentration for upward laminar flame propagation. With increasing dust concentration,
the quenching distance decreases systematically and reaches about 7 mm at about the