
Page 384 - Dust Explosions in the Process Industries
P. 384
Propagation of Flames in Dust Clouds 353
between each flame appearance. This finding is in agreement with Chapman and
Wheeler’s (1926)observationsof vibratorypremixed gas flames in a laboratorytube open
at both ends. They found that the “periodicity of the vibrations was that of the funda-
mental tone of the tube.” As already discussed and illustrated in Figure 4.36, Eckhoff et al.
(1987) observed the same phenomenon during dust explosions in a large vertical silo
of diameter 3.7 m, height 22 m, and vented at the top, provided the ignition point was
in the upper part of the silo. Greenwald and Wheeler (1925) also measured explosion
pressures at various locations in the large gallery. The maximum values recorded by the
low-frequency-responsemanometers available at that time were 5.0 bar(g), 4.8 bar(g),
3.3 bx(g), and 0.14bar(g) for the normally fully closed end fully closed, one-quarteropen,
half open, and fully open, respectively. Pressure recordings further upstream were lower
than this and decreased systematically with increasing distance to the downstream exit.
Fischer (1957)reported results from coal dust explosion experimentsin a 260 m long
experimental coal mine gallery of equivalent-circle cross-sectional diameter of 3.2 m,
that is, a LID of about 80. The main purpose of these experiments was to investigate
whether deposits of stone dust on shelves in the upper part of the gallery cross section
would prevent the propagation of coal dust explosionsin the gallery. However, it appeared
that, under certain circumstances,this stone dust had little effect and flame acceleration
phenomena of the same violent type as found by Greenwald and Wheeler (1925) were
observed, as shown in Figure 4.62.
;RESrRE tT CLOSED END Ibar(gl1
E
6 o,z y ;I
w ’
f 0.0 , , , 1 ’ ’ 7 , ’ ’ ‘I ’ ” ” ’ I ”
’
’
0 50 100 150 zoo 250
DISTANCE FROM IGNITION POINT AT CLOSED END Iml
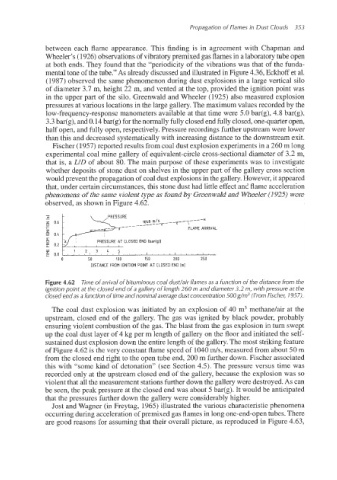
Figure 4.62 Time of arrival of bituminous coal dudair flames as a function ofthe distance from the
ignition point at the closed end of a gallery of length 260 m and diameter 3.2 m, with pressure at the
closed end as a function of time and nominal average dust concentration500 g/m3(From Fischer, 1957).
The coal dust explosion was initiated by an explosion of 40 m3 methane/air at the
upstream, closed end of the gallery. The gas was ignited by black powder, probably
ensuring violent combustion of the gas. The blast from the gas explosion in turn swept
up the coal dust layer of 4 kg per m length of gallery on the floor and initiated the self-
sustained dust explosion down the entire length of the gallery. The most striking feature
of Figure 4.62 is the very constant flame speed of 1040m/s, measured from about 50 m
from the closed end right to the open tube end, 200 m further down. Fischer associated
this with “some kind of detonation” (see Section 4.5). The pressure versus time was
recorded only at the upstream closed end of the gallery, because the explosion was so
violent that all the measurement stationsfurther down the gallery were destroyed.As can
be seen, the peak pressure at the closed end was about 5 bar(g). It would be anticipated
that the pressures further down the gallery were considerably higher.
Jsst and Wagner (in Freytag, 1965) illustrated the various characteristic phenomena
occurring during accelerationof premixed gas flames in long one-end-opentubes. There
are good reasons for assuming that their overall picture, as reproduced in Figure 4.63,