
Page 414 - Electrical Properties of Materials
P. 414
396 Superconductivity
where the resistance is a rapidly varying function of temperature. The change
in resistance is then calibrated as a function of the incident radiation.
14.8.7 Heat valves
The thermal conductivity of some superconductors may increase by as much
as two orders of magnitude, when made normal by a magnetic field.
This phenomenon may be used in heat valves in laboratory refrigeration
systems designed to obtain temperatures below 0.3 K.
14.9 High-T c superconductors
There were always hopes that superconductors would, one day, break out of
their low temperature habitat and have a significant impact upon the design
and operation of a wide range of devices. It was felt intuitively that Nature
could not possibly be so mean as to tuck away such a tremendously important
phenomenon into a dark corner of physics. Well, the break-out towards higher
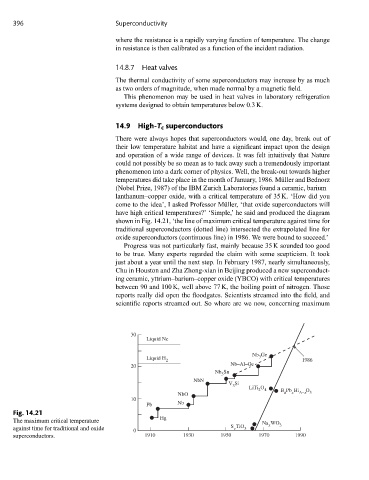
temperatures did take place in the month of January, 1986. Müller and Bednorz
(Nobel Prize, 1987) of the IBM Zurich Laboratories found a ceramic, barium–
lanthanum–copper oxide, with a critical temperature of 35 K. ‘How did you
come to the idea’, I asked Professor Müller, ‘that oxide superconductors will
have high critical temperatures?’ ‘Simple,’ he said and produced the diagram
shown in Fig. 14.21, ‘the line of maximum critical temperature against time for
traditional superconductors (dotted line) intersected the extrapolated line for
oxide superconductors (continuous line) in 1986. We were bound to succeed.’
Progress was not particularly fast, mainly because 35 K sounded too good
to be true. Many experts regarded the claim with some scepticism. It took
just about a year until the next step. In February 1987, nearly simultaneously,
Chu in Houston and Zha Zhong-xian in Beijing produced a new superconduct-
ing ceramic, yttrium–barium–copper oxide (YBCO) with critical temperatures
between 90 and 100 K, well above 77 K, the boiling point of nitrogen. Those
reports really did open the floodgates. Scientists streamed into the field, and
scientific reports streamed out. So where are we now, concerning maximum
30
Liquid Ne
Nb Ge
Liquid H 3
2 1986
20 Nb–Al–Ge
Nb Sn
3
NbN
V Si
3 LiTi O
O
x
a
NbO 2 4 B Pb Bi A–x 3
10
Pb Nb
Fig. 14.21
Hg
The maximum critical temperature Na WO
against time for traditional and oxide S TiO 3 x 3
v
0
superconductors. 1910 1930 1950 1970 1990