
Page 255 - Elements of Chemical Reaction Engineering Ebook
P. 255
226 Collection and Analysis of Rate Data Chap. 5
To obtain the derivative -dCA/dt used in this plot, we must differentiate the
concentration-time data either numerically or graphically. We describe three
methods to determine the derivative from data giving the concentration as a
function of time. These methods are:
Graphical differentiation
Numerical differentiation formulas
Differentiation of a polynomial fit to the data
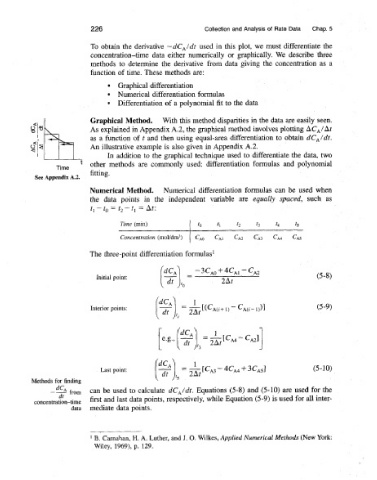
Graphical Method. With this method disparities in the data are easily seen.
As explained in Appendix A.2, the graphical method involves plotting ACA/At
as a function of t and then using equal-area differentiation to obtain dCA/dt,
An illustrative example is also given in Appendix A.2.
- In addition to the graphical technique used to differentiate the data, two
other methods are commonly used: differentiation formulas and polynomial
Time
fitting.
See Appendix A.2.
Numerical Method. Numerical differentiation formulas can be used when
the data points in the independent variable are equally spaced, such as
t, -to = t, - t, = At:
Erne (min) to ti 12 t3 t4 15
Concentration (rnol/dm3) CAo CAI CAZ CA3 CA4 CA5
The three-point differentiation formulas1
-3CAo+4cA1 -cA2
Initial point:
2At
I0
1
Last point: = 53;"A34cA4+3C~31 (5-1 0)
Methods for finding f5
-dA from can be used to calculate dCA/dt. Equations (5-8) and (5-10) are used for the
dr
first and last data points, respectively, while Equation (5-9) is used for all inter-
data mediate data points.
B. Carnahan, H. A. Luther, and J. 0. Wilkes, Applied Numerical Methods (New York:
Wiley, 1969), p. 129.