
Page 71 - Encyclopedia of Business and Finance
P. 71
eobf_B 7/5/06 2:55 PM Page 48
Balance of Trade
greater than would be true if each nation attempted to be
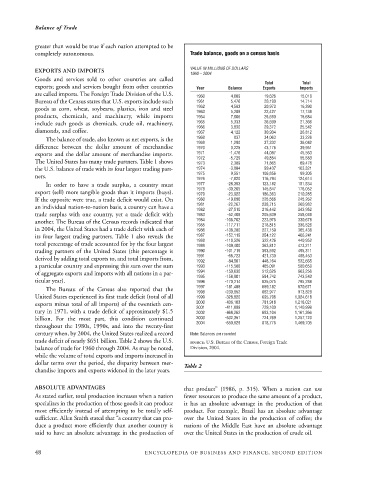
completely autonomous. Trade balance, goods on a census basis
VALUE IN MILLIONS OF DOLLARS
EXPORTS AND IMPORTS
1960 – 2004
Goods and services sold to other countries are called
Total Total
exports; goods and services bought from other countries Year Balance Exports Imports
are called imports. The Foreign Trade Division of the U.S.
1960 4,609 19,626 15,018
Bureau of the Census states that U.S. exports include such 1961 5,476 20,190 14,714
goods as corn, wheat, soybeans, plastics, iron and steel 1962 4,583 20,973 16,390
5,289
22,427
17,138
1963
products, chemicals, and machinery, while imports 1964 7,006 25,690 18,684
include such goods as chemicals, crude oil, machinery, 1965 5,333 26,699 21,366
1966 3,830 29,372 25,542
diamonds, and coffee. 1967 4,122 30,934 26,812
The balance of trade, also known as net exports, is the 1968 837 34,063 33,226
1969 1,290 37,332 36,042
difference between the dollar amount of merchandise 1970 3,225 43,176 39,951
exports and the dollar amount of merchandise imports. 1971 -1,476 44,087 45,563
1972 -5,729 49,854 55,583
The United States has many trade partners. Table 1 shows 1973 2,389 71,865 69,476
the U.S. balance of trade with its four largest trading part- 1974 -3,884 99,437 103,321
1975 9,551 106,856 99,305
ners.
1976 -7,820 116,794 124,614
In order to have a trade surplus, a country must 1977 -28,353 123,182 151,534
1978 -30,205 145,847 176,052
export (sell) more tangible goods than it imports (buys). 1979 -23,922 186,363 210,285
If the opposite were true, a trade deficit would exist. On 1980 -19,696 225,566 245,262
an individual nation-to-nation basis, a country can have a 1981 -22,267 238,715 260,982
1982 -27,510 216,442 243,952
trade surplus with one country, yet a trade deficit with 1983 -52,409 205,639 258,048
another. The Bureau of the Census records indicated that 1984 -106,702 223,976 330,678
1985 -117,711 218,815 336,526
in 2004, the United States had a trade deficit with each of 1986 -138,280 227,159 365,438
its four largest trading partners. Table 1 also reveals the 1987 -152,119 254,122 406,241
1988 -118,526 322,426 440,952
total percentage of trade accounted for by the four largest 1989 -109,400 363,812 473,211
trading partners of the United States (this percentage is 1990 -101,719 393,592 495,311
derived by adding total exports to, and total imports from, 1991 -66,723 421,730 488,453
1992 -84,501 448,164 532,665
a particular country and expressing this sum over the sum 1993 -115,568 465,091 580,659
of aggregate exports and imports with all nations in a par- 1994 -150,630 512,626 663,256
1995 -158,801 584,742 743,543
ticular year). 1996 -170,214 625,075 795,289
The Bureau of the Census also reported that the 1997 -181,488 689,182 870,671
1998 -230,852 682,977 913,828
United States experienced its first trade deficit (total of all 1999 -328,820 695,798 1,024,618
exports minus total of all imports) of the twentieth cen- 2000 -436,103 781,918 1,218,021
-411,899
2001
1,140,999
729,100
tury in 1971, with a trade deficit of approximately $1.5 2002 -468,262 693,104 1,161,366
billion. For the most part, this condition continued 2003 -532,351 724,769 1,257,120
2004 -650,929 818,776 1,469,705
throughout the 1980s, 1990s, and into the twenty-first
century when, by 2004, the United States realized a record Note: Balances are rounded
trade deficit of nearly $651 billion. Table 2 shows the U.S. SOURCE: U.S. Bureau of the Census, Foreign Trade
balance of trade for 1960 through 2004. As may be noted, Division, 2004.
while the volume of total exports and imports increased in
dollar terms over the period, the disparity between mer-
Table 2
chandise imports and exports widened in the later years.
ABSOLUTE ADVANTAGES that product” (1986, p. 315). When a nation can use
As stated earlier, total production increases when a nation fewer resources to produce the same amount of a product,
specializes in the production of those goods it can produce it has an absolute advantage in the production of that
most efficiently instead of attempting to be totally self- product. For example, Brazil has an absolute advantage
sufficient. Allen Smith stated that “a country that can pro- over the United States in the production of coffee; the
duce a product more efficiently than another country is nations of the Middle East have an absolute advantage
said to have an absolute advantage in the production of over the United States in the production of crude oil.
48 ENCYCLOPEDIA OF BUSINESS AND FINANCE, SECOND EDITION