
Page 154 - Engineered Interfaces in Fiber Reinforced Composites
P. 154
136 Engineered interfaces in jiber reinforced composites
whose approximate solution for b >> a is identical to /3, given in Eq. (4.3). Eq.
(4.107) suggests that the ratio of the bond strength at the bonded region to that at
the debonded region, q,/Zfr, and the Young’s modulus ratio, CL = Em/& , are key
material properties that determine zmax and thus control the stability of the debond
process. It should be noted here that in the early work of Lawrence (1972), Laws
et al. (1973) and later Gopalaratnam and Shah (1987) the maximum debond stress is
found to be dependent on these properties. Eq. (4.107) has a limiting value zmax = 0
when q, N zfr and y N 0 in which the debond process becomes totally stable as in
some ceramic matrix composites (e.g. Sic fiber-glass matrix composites (Butler
et al., 1990)).
From the discussion presented above, it is clear that the stability of the debond
process can be evaluated by a single parameter, zmax, which is the shortest
(remaining) bond length needed to maintain the debond process stable, and is a
constant for a given composite system. Therefore, three different interface debond
processes are identified in the following: totally unstable, partially stable and totally
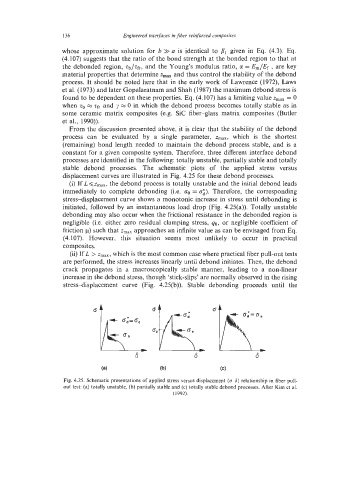
stable debond processes. The schematic plots of the applied stress versus
displacement curves are illustrated in Fig. 4.25 for these debond processes.
(i) If L <zmax, the debond process is totally unstable and the initial debond leads
immediately to complete debonding (i.e. GO = ni). Therefore, the corresponding
stress-displacement curve shows a monotonic increase in stress until debonding is
initiated, followed by an instantaneous load drop (Fig. 4.25(a)). Totally unstable
debonding may also occur when the frictional resistance in the debonded region is
negligible (i.e. either zero residual clamping stress, 40, or negligible coefficient of
friction p) such that zmaX approaches an infinite value as can be envisaged from Eq.
(4.107). However, this situation seems most unlikely to occur in practical
composites.
(ii) If L > z,,,, which is the most common case where practical fiber pull-out tests
are performed, the stress increases linearly until debond initiates. Then, the debond
crack propagates in a macroscopically stable manner, leading to a non-linear
increase in the debond stress, though ‘stick-slips’ are normally observed in the rising
stress-displacement curve (Fig. 4.25(b)). Stable debonding proceeds until the
(4 (b) (4
Fig. 4.25. Schematic presentations of applied stress versus displacement (0-6) relationship in fiber pull-
out test: (a) totally unstable, (b) partially stable and (c) totally stable debond processes. After Kim et al.
(1992).