
Page 331 - Enhanced Oil Recovery in Shale and Tight Reservoirs
P. 331
304 Enhanced Oil Recovery in Shale and Tight Reservoirs
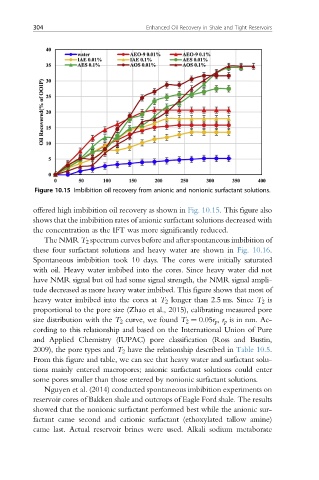
Figure 10.15 Imbibition oil recovery from anionic and nonionic surfactant solutions.
offered high imbibition oil recovery as shown in Fig. 10.15. This figure also
shows that the imbibition rates of anionic surfactant solutions decreased with
the concentration as the IFT was more significantly reduced.
The NMR T 2 spectrum curves before and after spontaneous imbibition of
these four surfactant solutions and heavy water are shown in Fig. 10.16.
Spontaneous imbibition took 10 days. The cores were initially saturated
with oil. Heavy water imbibed into the cores. Since heavy water did not
have NMR signal but oil had some signal strength, the NMR signal ampli-
tude decreased as more heavy water imbibed. This figure shows that most of
heavy water imbibed into the cores at T 2 longer than 2.5 ms. Since T 2 is
proportional to the pore size (Zhao et al., 2015), calibrating measured pore
size distribution with the T 2 curve, we found T 2 ¼ 0.05r p , r p is in nm. Ac-
cording to this relationship and based on the International Union of Pure
and Applied Chemistry (IUPAC) pore classification (Ross and Bustin,
2009), the pore types and T 2 have the relationship described in Table 10.5.
From this figure and table, we can see that heavy water and surfactant solu-
tions mainly entered macropores; anionic surfactant solutions could enter
some pores smaller than those entered by nonionic surfactant solutions.
Nguyen et al. (2014) conducted spontaneous imbibition experiments on
reservoir cores of Bakken shale and outcrops of Eagle Ford shale. The results
showed that the nonionic surfactant performed best while the anionic sur-
factant came second and cationic surfactant (ethoxylated tallow amine)
came last. Actual reservoir brines were used. Alkali sodium metaborate