
Page 501 - Enhanced Oil Recovery in Shale and Tight Reservoirs
P. 501
Other enhanced oil recovery methods 465
Table 14.1 Main fluid and rock properties used in the model.
Matrix permeability (mD) 0.0015
Matrix porosity 0.08
Reservoir thickness (ft) 10
Shale thermal conductivity (Btu/ft$day F) 30
Initial pressure (psi) 6840
Initial temperature ( F) 248
Initial kerogen concentration (weight%) 10
Oil viscosity (cp) 0.31
Hydraulic fracture half-length (ft) 200
Hydraulic fracture spacing (ft) 200
Well spacing (ft) 150
Natural fracture spacing (ft) 28
in the reservoir. The same well is used for production and heating; during
the heating, the well is not produced. In their simulation model, the prop-
erties of a Bakken oil are used. Table 14.1 lists the main fluid and rock prop-
erties used in the simulation model.
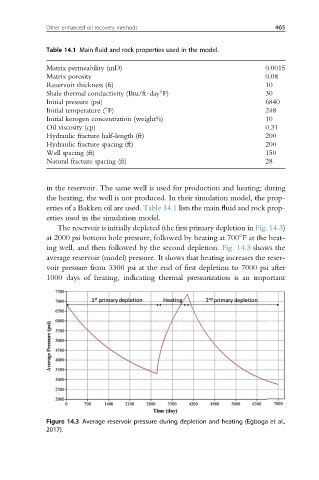
The reservoir is initially depleted (the first primary depletion in Fig. 14.3)
at 2000 psi bottom hole pressure, followed by heating at 700 F at the heat-
ing well, and then followed by the second depletion. Fig. 14.3 shows the
average reservoir (model) pressure. It shows that heating increases the reser-
voir pressure from 3300 psi at the end of first depletion to 7000 psi after
1000 days of heating, indicating thermal pressurization is an important
Figure 14.3 Average reservoir pressure during depletion and heating (Egboga et al.,
2017).