
Page 472 - Environmental Nanotechnology Applications and Impacts of Nanomaterials
P. 472
Ecotoxicological Impacts of Nanomaterials 449
TABLE 12.1 Common Biomarkers Used in Ecotoxicology
Organism Common name Common toxicological endpoint
Vibrio fischeri Bacterium Loss of fluorescence
Selenastrum Algae Growth inhibition
capricornutum
Terrestrial plants Rate of seedling emergence and growth
Daphnia magna Water flea Reproductive capacity, loss of mobility, death
Eisenia fetida Earthworm Reproductive capacity, death
Danio rerio Fish Developmental malformations, death
Xenopus laevis Frog Developmental malformations
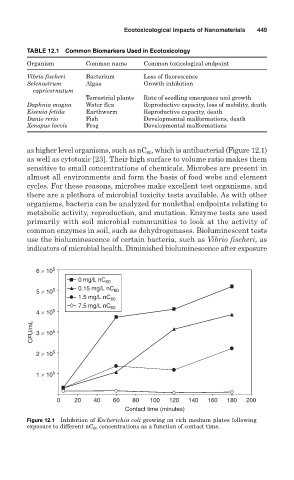
as higher level organisms, such as nC , which is antibacterial (Figure 12.1)
60
as well as cytotoxic [23]. Their high surface to volume ratio makes them
sensitive to small concentrations of chemicals. Microbes are present in
almost all environments and form the basis of food webs and element
cycles. For these reasons, microbes make excellent test organisms, and
there are a plethora of microbial toxicity tests available. As with other
organisms, bacteria can be analyzed for nonlethal endpoints relating to
metabolic activity, reproduction, and mutation. Enzyme tests are used
primarily with soil microbial communities to look at the activity of
common enzymes in soil, such as dehydrogenases. Bioluminescent tests
use the bioluminescence of certain bacteria, such as Vibrio fischeri, as
indicators of microbial health. Diminished bioluminescence after exposure
6 × 10 5
0 mg/L nC 60
5 × 10 5 0.15 mg/L nC 60
1.5 mg/L nC 60
7.5 mg/L nC 60
4 × 10 5
CFU/mL 3 × 10 5
2 × 10 5
1 × 10 5
0 20 40 60 80 100 120 140 160 180 200
Contact time (minutes)
Figure 12.1 Inhibition of Escherichia coli growing on rich medium plates following
exposure to different nC 60 concentrations as a function of contact time.