Page 44 - Essentials of physical chemistry
P. 44

6                                                    Essentials of Physical Chemistry


                                                Charles’ law data
                           124
                           122
                           120
                          Gas volume  116
                           118
                           114
                           112
                                                        y =0.3843x +107.85
                           110
                                                        2
                                                       R =0.9999
                           108
                           106
                               0       10        20       30       40       50
                                                Degrees centigrade
                                                                           2
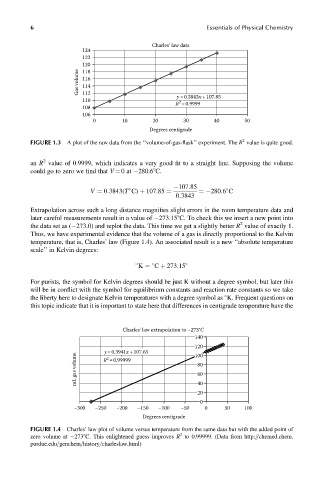
            FIGURE 1.3  A plot of the raw data from the ‘‘volume-of-gas-flask’’ experiment. The R value is quite good.
                2
            an R value of 0.9999, which indicates a very good fit to a straight line. Supposing the volume
            could go to zero we find that V ¼ 0at  280.68C.

                                                        107:85
                                                              ¼ 280:6 C

                              V ¼ 0:3843(T C) þ 107:85 ¼
                                                       0:3843
            Extrapolation across such a long distance magnifies slight errors in the room temperature data and
            later careful measurements result in a value of  273.158C. To check this we insert a new point into
                                                                           2
            the data set as ( 273.0) and replot the data. This time we get a slightly better R value of exactly 1.
            Thus, we have experimental evidence that the volume of a gas is directly proportional to the Kelvin
            temperature, that is, Charles’ law (Figure 1.4). An associated result is a new ‘‘absolute temperature
            scale’’ in Kelvin degrees:

                                            K ¼ C þ 273:15

            For purists, the symbol for Kelvin degrees should be just K without a degree symbol, but later this
            will be in conflict with the symbol for equilibrium constants and reaction rate constants so we take
            the liberty here to designate Kelvin temperatures with a degree symbol as K. Frequent questions on

            this topic indicate that it is important to state here that differences in centigrade temperature have the


                                       Charles’ law extrapolation to –273°C
                                                             140
                                                             120
                         mL gas volume  R =0.99999            80
                                  y =0.3941x +107.65
                                                             100
                                   2
                                                              60
                                                              40
                                                              20
                                                               0
                         –300  –250   –200  –150  –100   –50    0     50    100
                                             Degrees centigrade
            FIGURE 1.4  Charles’ law plot of volume versus temperature from the same data but with the added point of
                                                         2
            zero volume at  2738C. This enlightened guess improves R to 0.99999. (Data from http:==chemed.chem.
            purdue.edu=genchem=history=charleslaw.html)
   39   40   41   42   43   44   45   46   47   48   49