Page 313 - Fair, Geyer, and Okun's Water and wastewater engineering : water supply and wastewater removal
P. 313

JWCL344_ch08_265-296.qxd  8/2/10  9:53 PM  Page 273


                                                                                          8.2 Pump Characteristics  273

                                                120
                                                                                           Tank full, source
                                                110
                                                                                             at low level
                                                100

                                                 90

                                                 80                                                    Pumps
                                                                                                       2 and 3
                                                 70                                                  Pumps
                                               Total head, ft  60                        Pump        1 and 3

                                                                                           3
                                                                                                Pumps
                                                         Tank empty,
                                                 50
                                                         source at             Pump             1 and 2
                                                                                 2
                                                         high level
                                                 40                Pump     Range in
                                                                     1     system head
                                                 30
                                                              Minimum demand          Normal demand  Maximum demand
                                                 20

                                                 10

                                                 0
                                                   0        10       20        30        40       50        60
                                                                       Rate of pumping, MGD
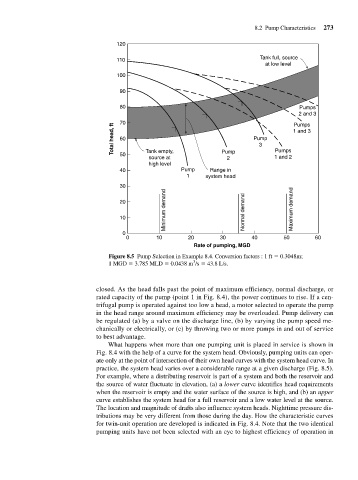
                                             Figure 8.5 Pump Selection in Example 8.4. Conversion factors : 1 ft   0.3048m;
                                                                       3
                                             1 MGD   3.785 MLD   0.0438 m /s   43.8 L/s.


                                         closed. As the head falls past the point of maximum efficiency, normal discharge, or
                                         rated capacity of the pump (point 1 in Fig. 8.4), the power continues to rise. If a cen-
                                         trifugal pump is operated against too low a head, a motor selected to operate the pump
                                         in the head range around maximum efficiency may be overloaded. Pump delivery can
                                         be regulated (a) by a valve on the discharge line, (b) by varying the pump speed me-
                                         chanically or electrically, or (c) by throwing two or more pumps in and out of service
                                         to best advantage.
                                             What happens when more than one pumping unit is placed in service is shown in
                                         Fig. 8.4 with the help of a curve for the system head. Obviously, pumping units can oper-
                                         ate only at the point of intersection of their own head curves with the system head curve. In
                                         practice, the system head varies over a considerable range at a given discharge (Fig. 8.5).
                                         For example, where a distributing reservoir is part of a system and both the reservoir and
                                         the source of water fluctuate in elevation, (a) a lower curve identifies head requirements
                                          when the reservoir is empty and the water surface of the source is high, and (b) an upper
                                          curve establishes the system head for a full reservoir and a low water level at the source.
                                          The location and magnitude of drafts also influence system heads. Nighttime pressure dis-
                                          tributions may be very different from those during the day. How the characteristic curves
                                          for twin-unit operation are developed is indicated in Fig. 8.4. Note that the two identical
                                          pumping units have not been selected with an eye to highest efficiency of operation in
   308   309   310   311   312   313   314   315   316   317   318