
Page 99 - Fair, Geyer, and Okun's Water and wastewater engineering : water supply and wastewater removal
P. 99
JWCL344_ch03_061-117.qxd 8/17/10 7:48 PM Page 62
62 Chapter 3 Water Sources: Groundwater
Table 3.1 U.S. Water Sources in 2007 (Courtesy U.S. Environmental Protection Agency)
Water System Groundwater Surface Water Totals
Community No. of systems 40,646 11,449 52,095
water system 1 Population served 90,549,995 195,887,109 286,437,104
Percentage of systems 78% 22% 100%
Percentage of population 32% 68% 100%
Nontransient No. of systems 18,151 679 18,830
noncommunity Population served 5,503,282 787,555 6,290,837
water system 2 Percentage of systems 96% 4% 100%
Percentage of population 87% 13% 100%
Transient No. of systems 82,851 1,878 84,729
noncommunity Population served 11,077,369 2,668,985 13,746,354
water system 3 Percentage of systems 98% 2% 100%
Percentage of population 81% 19% 100%
Total no. of systems 141,648 14,006 155,654
1 Community water system: a public water system that supplies water to the same population year-round.
2 Nontransient noncommunity water system: a public water system that regularly supplies water to at least 25 of
the same people at least 6 months per year, but not year-round. Some examples are schools, factories, office build-
ings, and hospitals that have their own water systems.
3 Transient noncommunity water system: a public water system that provides water in a place such as a gas station
or campground where people do not remain for long periods of time.
Source: Courtesy U.S. Environmental Protection Agency.
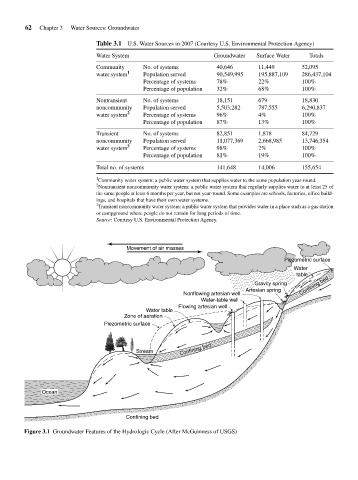
Movement of air masses
Piezometric surface
Water
table
Gravity spring Confining bed
Artesian spring
Nonflowing artesian well
Water-table well
Flowing artesian well
Water table
Zone of aeration
Piezometric surface
Confining bed
Stream
Ocean
Confining bed
Figure 3.1 Groundwater Features of the Hydrologic Cycle (After McGuinness of USGS)