
Page 44 - Fiber Bragg Gratings
P. 44
2.4. Photosensitization techniques 25
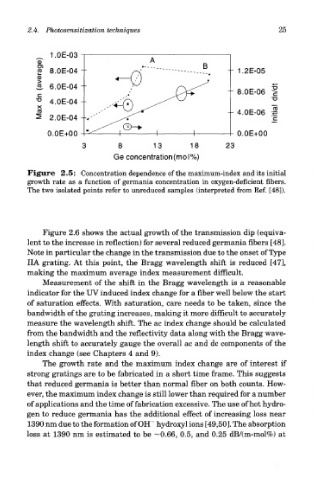
Figure 2.5: Concentration dependence of the maximum-index and its initial
growth rate as a function of germania concentration in oxygen-deficient fibers.
The two isolated points refer to unreduced samples (interpreted from Ref. [48]).
Figure 2.6 shows the actual growth of the transmission dip (equiva-
lent to the increase in reflection) for several reduced germania fibers [48].
Note in particular the change in the transmission due to the onset of Type
IIA grating. At this point, the Bragg wavelength shift is reduced [47],
making the maximum average index measurement difficult.
Measurement of the shift in the Bragg wavelength is a reasonable
indicator for the UV induced index change for a fiber well below the start
of saturation effects. With saturation, care needs to be taken, since the
bandwidth of the grating increases, making it more difficult to accurately
measure the wavelength shift. The ac index change should be calculated
from the bandwidth and the reflectivity data along with the Bragg wave-
length shift to accurately gauge the overall ac and dc components of the
index change (see Chapters 4 and 9).
The growth rate and the maximum index change are of interest if
strong gratings are to be fabricated in a short time frame. This suggests
that reduced germania is better than normal fiber on both counts. How-
ever, the maximum index change is still lower than required for a number
of applications and the time of fabrication excessive. The use of hot hydro-
gen to reduce germania has the additional effect of increasing loss near
1390 nm due to the formation of OH~ hydroxyl ions [49,50]. The absorption
loss at 1390 nm is estimated to be -0.66, 0.5, and 0.25 dB/(m-mol%) at