
Page 152 - Fiber Fracture
P. 152
STRENGTH OF GLASS FIBERS 137
different equation will be obtained which will show that the strength will increase with
increase in temperature (different from the prediction of Eq. 16) due to rapid desorption
of water from the crack surface.
The Humidity Dependence of Strength
Using Eq. 8, it can also be shown (Gupta, 1983) that at a fixed temperature and a fixed
strain rate, strength will decrease with increase in the relative humidity of the testing
environment according to the following equation:
In S(X) = -[a/(N + I)] In X +constant (17)
EXTRINSIC STRENGTH OF GLASS FIBERS - EXPERIMENTAL RESULTS
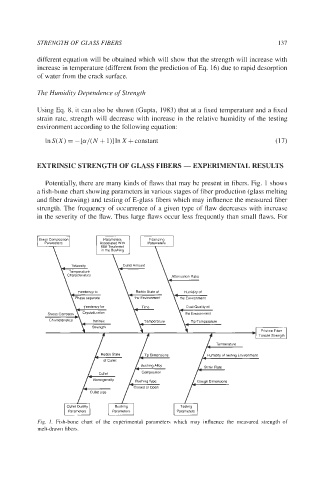
Potentially, there are many kinds of flaws that may be present in fibers. Fig. 1 shows
a fish-bone chart showing parameters in various stages of fiber production (glass melting
and fiber drawing) and testing of E-glass fibers which may influence the measured fiber
strength. The frequency of occurrence of a given type of flaw decreases with increase
in the severity of the flaw. Thus large flaws occur less frequently than small flaws. For
Glass Composition Fiberizing
Associaled With
Mall Treatment
in the Bushing
Viscositv L\ Cullel Amount
Anenuatlon Ratio
the Environment
Tp-Temperalure
Pristine Fiber
Tensile Strength
Humidity of Testing Environment
Gauge Dimensions
Parameters Parameters Parameters
Fig. 1. Fish-bone chart of the experimental parameters which may influence the measured strength of
melt-drawn fibers.