
Page 165 - Fluid-Structure Interactions Slender Structure and Axial Flow (Volume 1)
P. 165
PIPES CONVEYING FLUID: LINEAR DYNAMICS I 147
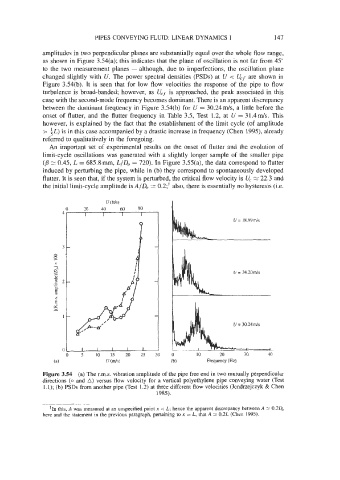
amplitudes in two perpendicular planes are substantially equal over the whole flow range,
as shown in Figure 3.54(a); this indicates that the plane of oscillation is not far from 45"
to the two measurement planes - although, due to imperfections, the oscillation plane
changed slightly with U. The power spectral densities (PSDs) at U < U,f are shown in
Figure 3.54(b). It is seen that for low flow velocities the response of the pipe to flow
turbulence is broad-banded; however, as Uc. is approached, the peak associated in this
case with the second-mode frequency becomes dominant. There is an apparent discrepancy
between the dominant frequency in Figure 3.54(b) for U = 30.24m/s, a little before the
onset of flutter, and the flutter frequency in Table 3.5, Test 1.2, at U = 31.4ds. This
however, is explained by the fact that the establishment of the limit cycle (of amplitude
> iL) is in this case accompanied by a drastic increase in frequency (Chen 1995), already
referred to qualitatively in the foregoing.
An important set of experimental results on the onset of flutter and the evolution of
limit-cycle oscillations was generated with a slightly longer sample of the smaller pipe
(j3 2 0.45, L = 685.8 mm, LID, = 720). In Figure 3.55(a), the data correspond to flutter
induced by perturbing the pipe, while in (b) they correspond to spontaneously developed
flutter. It is seen that, if the system is perturbed, the critical flow velocity is U, 2 22.3 and
the initial limit-cycle amplitude is A/D, = 0.2;+ also, there is essentially no hysteresis (i.e.
u (ft/S)
20 40 60 80
4
1 I I I
3
5
X
0 5 10 15 20 25 30 0 10 20 30 40
(a) u (dS) (b) Frequency (Hz)
Figure 3.54 (a) The r.m.s. vibration amplitude of the pipe free end in two mutually perpendicular
directions (0 and A) versus flow velocity for a vertical polyethylene pipe conveying water (Test
1.1); (b) PSDs from another pipe (Test 1.2) at three different flow velocities (Jendrzejczyk & Chen
1985).
+In this, A was measured at an unspecified point x < L; hence the apparent discrepancy between A = 0.2~9,~
here and the statement in the previous paragraph, pertaining to x = L, that A 2 0.2L (Chen 1995).