
Page 48 - Fluid-Structure Interactions Slender Structure and Axial Flow (Volume 1)
P. 48
CONCEPTS, DEFINITIONS AND METHODS 31
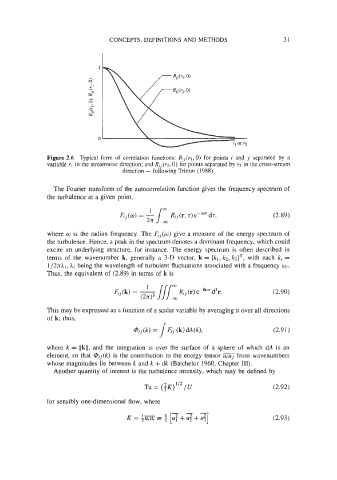
Figure 2.6 Typical form of correlation functions: R,](rI, 0) for points i and j separated by a
variable rl in the streamwise direction; and R,,(r2, 0) for points separated by rz in the cross-stream
direction - following Tritton (1988).
The Fourier transform of the autocorrelation function gives the frequency spectrum of
the turbulence at a given point,
to
fi,(u) = / R;,(r, r)ePiwr dr, (2.89)
2rc --w
where w is the radian frequency. The fij(w) give a measure of the energy spectrum of
the turbulence. Hence, a peak in the spectrum denotes a dominant frequency, which could
excite an underlying structure, for instance. The energy spectrum is often described in
terms of the wavenumber k, generally a 3-D vector, k = (kl, k2, k3IT, with each k; =
1/2rcA;, A; being the wavelength of turbulent fluctuations associated with a frequency w;.
Thus, the equivalent of (2.89) in terms of k is
(2.90)
This may be expressed as a function of a scalar variable by averaging it over all directions
s
of k; thus,
@;j(k) = 4j (k) dA(k), (2.9 1 )
where k = llkll, and the integration is over the surface of a sphere of which dA is an
element, so that @;,(k) is the contribution to the energy tensor uiuj from wavenumbers
whose magnitudes lie between k and k + dk (Batchelor 1960, Chapter 111).
Another quantity of interest is the turbulence intensity, which may be defined by
112
TU= ($K) /U (2.92)
for sensibly one-dimensional flow, where