
Page 99 - Fluid Catalytic Cracking Handbook
P. 99
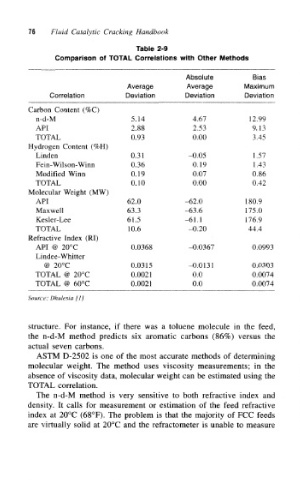
76  Fluid Catalytic Cracking Handbook

                            Table 2-9
       Comparison of TOTAL Correlations with Other Methods

                                         Absolute         Bias
                          Average        Average        Maximum
     Correlation         Deviation       Deviation      Deviation
 Carbon Content (%C)
  n-d-M                    5.14            4.67           12.99
  API                      2.88            2.53           9.13
  TOTAL                    0.93            0.00           3.45
 Hydrogen Content (%H)
  Linden                  0.31            -0.05            1.57
  Fein-Wilson-Winn        0.36             0.19            1.43
  Modified Winn            0.19            0.07           0.86
  TOTAL                   0.10             0.00           0.42
 Molecular Weight (MW)
  API                     62.0           -62.0          180.9
  Maxwell                63.3            -63.6          175.0
  Kesler-Lee             61.5            -61.1          176.9
  TOTAL                   10.6            -0.20          44.4
 Refractive Index (RI)
  API @ 20°C               0.0368         -0.0367         0.0993
  Lindee-Whitter
    @ 20°C                 0.0315         -0.0131         0.0303
  TOTAL @ 20°C            0.0021           0.0            0.0074
  TOTAL @ 60°C            0.0021           0.0            0.0074

 Source: Dhuleaia [1]


 structure. For instance, if there was a toluene molecule in the feed,
 the n-d-M method predicts six aromatic carbons (86%) versus the
 actual seven carbons.
  ASTM D-2502 is one of the most accurate methods of determining
 molecular weight. The method uses viscosity measurements; in the
 absence of viscosity data, molecular weight can be estimated using the
 TOTAL correlation.
  The n-d-M method is very sensitive to both refractive index and
 density. It calls for measurement or estimation of the feed refractive
 index at 20°C (68°F). The problem is that the majority of FCC feeds
 are virtually solid at 20°C and the refractometer is unable to measure