
Page 98 - Forensic Structural Engineering Handbook
P. 98
2.4 DESIGN AND CONSTRUCTION PRACTICES
6
years. The main thrust has been to examine by various probabilistic methods the chances
of failure, or limit, states to develop. Limit states are generally defined as those conditions of a
structure at which it ceases to fulfill its intended function, and can be divided into two categories,
strength and serviceability. Strength (i.e., safety) limit states are such behavioral phenomena as
the onset of yielding, formation of a plastic hinge, overall frame or member instability, lateral-
torsional buckling, local buckling, tensile fracture, and development of fatigue cracks.
Serviceability limit states include unacceptable elastic deflections and drift, unacceptable vibra-
tions, and permanent deformations. Design criteria should ensure that a limit state is violated
only with an acceptably small probability, by selecting the load and resistance factors and nom-
inal load and resistance values that will never be exceeded under the design assumptions.
Both the acting loads and the resistance (strength) of the structure to loads are variables
that must be considered. In general, a thorough analysis of all uncertainties that might influ-
ence achieving a limit state is not practical, or perhaps even possible. The current approach to
a simplified method using a probability-based assessment of structural safety uses first-order
7
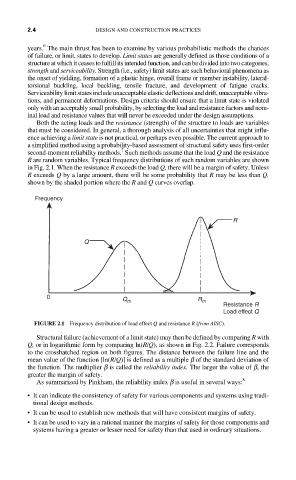
second-moment reliability methods. Such methods assume that the load Q and the resistance
R are random variables. Typical frequency distributions of such random variables are shown
in Fig. 2.1. When the resistance R exceeds the load Q, there will be a margin of safety. Unless
R exceeds Q by a large amount, there will be some probability that R may be less than Q,
shown by the shaded portion where the R and Q curves overlap.
Frequency
R
Q
0
Q m R m
Resistance R
Load effect Q
FIGURE 2.1 Frequency distribution of load effect Q and resistance R (from AISC).
Structural failure (achievement of a limit state) may then be defined by comparing R with
Q, or in logarithmic form by comparing ln(R/Q), as shown in Fig. 2.2. Failure corresponds
to the crosshatched region on both figures. The distance between the failure line and the
mean value of the function [ln(R/Q)] is defined as a multiple b of the standard deviation of
the function. The multiplier b is called the reliability index. The larger the value of b, the
greater the margin of safety.
As summarized by Pinkham, the reliability index b is useful in several ways: 8
• It can indicate the consistency of safety for various components and systems using tradi-
tional design methods.
• It can be used to establish new methods that will have consistent margins of safety.
• It can be used to vary in a rational manner the margins of safety for those components and
systems having a greater or lesser need for safety than that used in ordinary situations.