
Page 140 - Formation Damage during Improved Oil Recovery Fundamentals and Applications
P. 140
Formation Damage by Fines Migration: Mathematical and Laboratory Modeling, Field Cases 119
Now, consider two points X 1 , X 2 at the moment T 3 in zone 2.
There are no suspended particles in zone 2, so the strained profile is con-
stant with time. Strained concentration in zone 2 remains the same as
that reached at the moment of the passing of the particle front. In zone 1,
particle straining at point X 2 has been occurring for longer than at point
X 1 , so the strained concentration at point X 2 is higher than at point X 1 .
The envelope profile in Fig. 3.16C increases.
3.5.2 Tuning experimental data
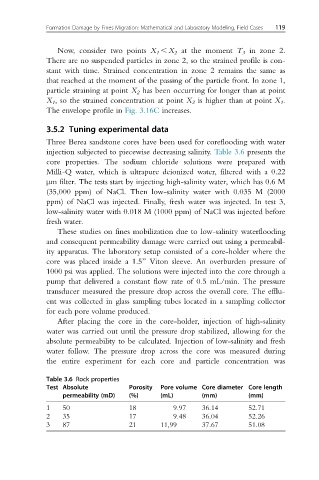
Three Berea sandstone cores have been used for coreflooding with water
injection subjected to piecewise decreasing salinity. Table 3.6 presents the
core properties. The sodium chloride solutions were prepared with
Milli-Q water, which is ultrapure deionized water, filtered with a 0.22
μm filter. The tests start by injecting high-salinity water, which has 0.6 M
(35,000 ppm) of NaCl. Then low-salinity water with 0.035 M (2000
ppm) of NaCl was injected. Finally, fresh water was injected. In test 3,
low-salinity water with 0.018 M (1000 ppm) of NaCl was injected before
fresh water.
These studies on fines mobilization due to low-salinity waterflooding
and consequent permeability damage were carried out using a permeabil-
ity apparatus. The laboratory setup consisted of a core-holder where the
core was placed inside a 1.5” Viton sleeve. An overburden pressure of
1000 psi was applied. The solutions were injected into the core through a
pump that delivered a constant flow rate of 0.5 mL/min. The pressure
transducer measured the pressure drop across the overall core. The efflu-
ent was collected in glass sampling tubes located in a sampling collector
for each pore volume produced.
After placing the core in the core-holder, injection of high-salinity
water was carried out until the pressure drop stabilized, allowing for the
absolute permeability to be calculated. Injection of low-salinity and fresh
water follow. The pressure drop across the core was measured during
the entire experiment for each core and particle concentration was
Table 3.6 Rock properties
Test Absolute Porosity Pore volume Core diameter Core length
permeability (mD) (%) (mL) (mm) (mm)
1 50 18 9.97 36.14 52.71
2 35 17 9.48 36.04 52.26
3 87 21 11,99 37.67 51.08