
Page 216 - Formation Damage during Improved Oil Recovery Fundamentals and Applications
P. 216
190 Bin Yuan and Rouzbeh G. Moghanloo
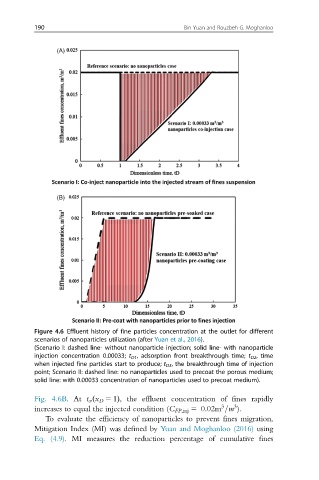
Figure 4.6 Effluent history of fine particles concentration at the outlet for different
scenarios of nanoparticles utilization (after Yuan et al., 2016).
(Scenario I: dashed line- without nanoparticle injection; solid line- with nanoparticle
injection concentration 0.00033; t D1 , adsorption front breakthrough time; t D2 , time
when injected fine particles start to produce; t D3 , the breakthrough time of injection
point; Scenario II: dashed line: no nanoparticles used to precoat the porous medium;
solid line: with 0.00033 concentration of nanoparticles used to precoat medium).
Fig. 4.6B.At t cr ðx D 5 1Þ, the effluent concentration of fines rapidly
3
3
increases to equal the injected condition (C FP;inj 5 0:02m =m ).
To evaluate the efficiency of nanoparticles to prevent fines migration,
Mitigation Index (MI) was defined by Yuan and Moghanloo (2016) using
Eq. (4.9). MI measures the reduction percentage of cumulative fines