
Page 68 - Fundamentals of Air Pollution 3E
P. 68
44 4. Air Quality
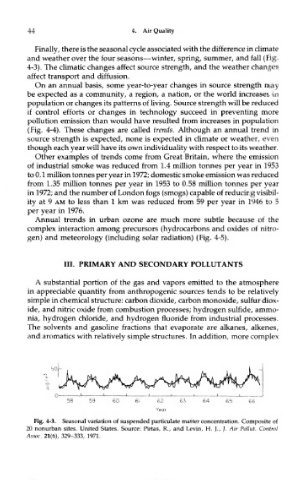
Finally, there is the seasonal cycle associated with the difference in climate
and weather over the four seasons—winter, spring, summer, and fall (Fig.
4-3). The climatic changes affect source strength, and the weather changes
affect transport and diffusion.
On an annual basis, some year-to-year changes in source strength may
be expected as a community, a region, a nation, or the world increases in
population or changes its patterns of living. Source strength will be reduced
if control efforts or changes in technology succeed in preventing more
pollution emission than would have resulted from increases in population
(Fig. 4-4). These changes are called trends. Although an annual trend in
source strength is expected, none is expected in climate or weather, even
though each year will have its own individuality with respect to its weather.
Other examples of trends come from Great Britain, where the emission
of industrial smoke was reduced from 1.4 million tonnes per year in 1953
to 0.1 million tonnes per year in 1972; domestic smoke emission was reduced
from 1.35 million tonnes per year in 1953 to 0.58 million tonnes per year
in 1972; and the number of London fogs (smogs) capable of reducing visibil-
ity at 9 AM to less than 1 km was reduced from 59 per year in 1946 to 5
per year in 1976.
Annual trends in urban ozone are much more subtle because of the
complex interaction among precursors (hydrocarbons and oxides of nitro-
gen) and meteorology (including solar radiation) (Fig. 4-5).
III. PRIMARY AND SECONDARY POLLUTANTS
A substantial portion of the gas and vapors emitted to the atmosphere
in appreciable quantity from anthropogenic sources tends to be relatively
simple in chemical structure: carbon dioxide, carbon monoxide, sulfur diox-
ide, and nitric oxide from combustion processes; hydrogen sulfide, ammo-
nia, hydrogen chloride, and hydrogen fluoride from industrial processes.
The solvents and gasoline fractions that evaporate are alkanes, alkenes,
and aroma tics with relatively simple structures. In addition, more complex
Fig. 4-3. Seasonal variation of suspended particulate matter concentration. Composite of
20 nonurban sites. United States. Source: Pirtas, R., and Levin, H. ],, ]. Air Pottut. Control
Assoc. 21(6), 329-333, 1971.