
Page 192 - Fundamentals of Air Pollution
P. 192
158 11. Long-Term Effects on the Planet
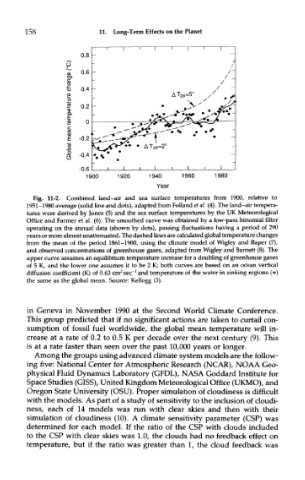
Fig. 11-2. Combined land-air and sea surface temperatures from 1900, relative to
1951-1980 average (solid line and dots), adapted from Folland et al. (4). The land-air tempera-
tures were derived by Jones (5) and the sea surface temperatures by the UK Meteorological
Office and Farmer et al. (6). The smoothed curve was obtained by a low-pass binomial filter
operating on the annual data (shown by dots), passing fluctuations having a period of 290
years or more almost unattenuated. The dashed lines are calculated global temperature changes
from the mean of the period 1861-1900, using the climate model of Wigley and Raper (7),
and observed concentrations of greenhouse gases, adapted from Wigley and Barnett (8). The
upper curve assumes an equilibrium temperature increase for a doubling of greenhouse gases
of 5 K, and the lower one assumes it to be 2 K; both curves are based on an ocean vertical
1
2
diffusion coefficient (K) of 0.63 cm sec" and temperature of the water in sinking regions (n)
the same as the global mean. Source: Kellogg (3).
in Geneva in November 1990 at the Second World Climate Conference.
This group predicted that if no significant actions are taken to curtail con-
sumption of fossil fuel worldwide, the global mean temperature will in-
crease at a rate of 0.2 to 0.5 K per decade over the next century (9). This
is at a rate faster than seen over the past 10,000 years or longer.
Among the groups using advanced climate system models are the follow-
ing five: National Center for Atmospheric Research (NCAR), NOAA Geo-
physical Fluid Dynamics Laboratory (GFDL), NASA Goddard Institute for
Space Studies (GISS), United Kingdom Meteorological Office (UKMO), and
Oregon State University (OSU). Proper simulation of cloudiness is difficult
with the models. As part of a study of sensitivity to the inclusion of cloudi-
ness, each of 14 models was run with clear skies and then with their
simulation of cloudiness (10). A climate sensitivity parameter (CSP) was
determined for each model. If the ratio of the CSP with clouds included
to the CSP with clear skies was 1.0, the clouds had no feedback effect on
temperature, but if the ratio was greater than 1, the cloud feedback was