
Page 239 - Fundamentals of Air Pollution
P. 239
202 14. Ambient Air Pollutant Analysis and Measurement
analytical techniques have expressed results in this unit, and (3) consider-
able information has been developed on the role of hydrocarbons in the
atmosphere in terms of concentrations determined as parts per million by
carbon.
Historically, measurements have classified ambient hydrocarbons in two
classes: methane (CH 4) and all other nonmethane volatile organic com-
pounds (NMVOCs). Analyzing hydrocarbons in the atmosphere involves
a three-step process: collection, separation, and quantification. Collection
involves obtaining an aliquot of air, e.g., with an evacuated canister. The
principal separation process is gas chromatography (GC), and the principal
quantification technique is with a calibrated flame ionization detector (FID).
Mass spectroscopy (MS) is used along with GC to identify individual hydro-
carbon compounds.
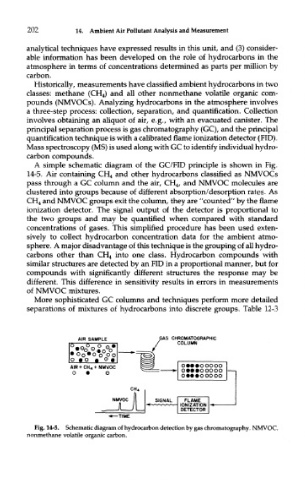
A simple schematic diagram of the GC/FID principle is shown in Fig.
14-5. Air containing CH 4 and other hydrocarbons classified as NMVOCs
pass through a GC column and the air, CH 4, and NMVOC molecules are
clustered into groups because of different absorption/desorption rates. As
CH 4 and NMVOC groups exit the column, they are "counted" by the flame
ionization detector. The signal output of the detector is proportional to
the two groups and may be quantified when compared with standard
concentrations of gases. This simplified procedure has been used exten-
sively to collect hydrocarbon concentration data for the ambient atmo-
sphere. A major disadvantage of this technique is the grouping of all hydro-
carbons other than CH 4 into one class. Hydrocarbon compounds with
similar structures are detected by an FID in a proportional manner, but for
compounds with significantly different structures the response may be
different. This difference in sensitivity results in errors in measurements
of NMVOC mixtures.
More sophisticated GC columns and techniques perform more detailed
separations of mixtures of hydrocarbons into discrete groups. Table 12-3
Fig. 14-5. Schematic diagram of hydrocarbon detection by gas chromatography. NMVOC,
nonmethane volatile organic carbon.