
Page 246 - Fundamentals of Air Pollution
P. 246
V. Analysis and Measurement of Acidic Deposition 209
merit may view distant objects with a much smaller viewing angle. The
output of the photodetector is closely related to the perceived optical proper-
ties of distant targets. Telephotorneters are often used to measure the
contrast between a distant object and its surroundings, a measurement
much closer to the human observer's perception of objects.
A transmissometer is similar to a telephotometer except that the target
is a known light source. If we know the characteristics of the source, the
average extinction coefficient over the path of the beam may be calculated.
Transmissometers are not very portable in terms of looking at a scene from
several directions. They are also very sensitive to atmospheric turbulence,
which limits the length of the light beam.
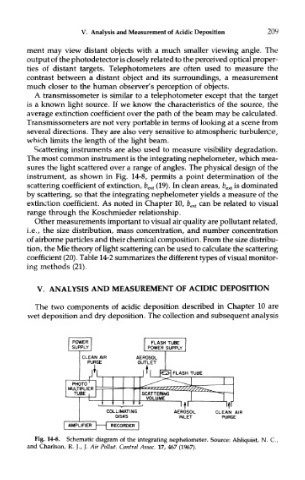
Scattering instruments are also used to measure visibility degradation.
The most common instrument is the integrating nephelometer, which mea-
sures the light scattered over a range of angles. The physical design of the
instrument, as shown in Fig. 14-8, permits a point determination of the
scattering coefficient of extinction, fr ext (19). In clean areas, b exi is dominated
by scattering, so that the integrating nephelometer yields a measure of the
extinction coefficient. As noted in Chapter 10, b ext can be related to visual
range through the Koschmieder relationship.
Other measurements important to visual air quality are pollutant related,
i.e., the size distribution, mass concentration, and number concentration
of airborne particles and their chemical composition. From the size distribu-
tion, the Mie theory of light scattering can be used to calculate the scattering
coefficient (20). Table 14-2 summarizes the different types of visual monitor-
ing methods (21).
V. ANALYSIS AND MEASUREMENT OF ACIDIC DEPOSITION
The two components of acidic deposition described in Chapter 10 are
wet deposition and dry deposition. The collection and subsequent analysis
Fig. 14-8. Schematic diagram of the integrating nephelometer. Source: Ahliquist, N. C.
and Charlson, R. J., /. Air Pollut. Control Assoc. 17, 467 (1967).