
Page 54 - Fundamentals of Air Pollution
P. 54
30 2. The Natural versus Polluted Atmosphere
are removed from the atmosphere are called scavenging mechanisms, and
the measure used for the aging of a pollutant is its half-life—the time it
takes for half of the quantity of pollutant emanating from a source to
disappear into its various sinks. Fortunately, most pollutants have a short
enough half-life (i.e., days rather than decades) to prevent their accumula-
tion in the air to the extent that they substantially alter the composition of
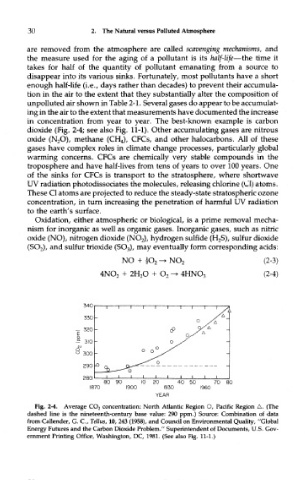
unpolluted air shown in Table 2-1. Several gases do appear to be accumulat-
ing in the air to the extent that measurements have documented the increase
in concentration from year to year. The best-known example is carbon
dioxide (Fig, 2-4; see also Fig. 11-1). Other accumulating gases are nitrous
oxide (N 2O), methane (CH 4), CFCs, and other halocarbons. All of these
gases have complex roles in climate change processes, particularly global
warming concerns. CFCs are chemically very stable compounds in the
troposphere and have half-lives from tens of years to over 100 years. One
of the sinks for CFCs is transport to the stratosphere, where shortwave
UV radiation photodissociates the molecules, releasing chlorine (Cl) atoms,
These Cl atoms are projected to reduce the steady-state stratospheric ozone
concentration, in turn increasing the penetration of harmful UV radiation
to the earth's surface.
Oxidation, either atmospheric or biological, is a prime removal mecha-
nism for inorganic as well as organic gases. Inorganic gases, such as nitric
oxide (NO), nitrogen dioxide (NO 2), hydrogen sulfide (H 2S), sulfur dioxide
(SO 2), and sulfur trioxide (SO 3), may eventually form corresponding acids:
Fig. 2-4. Average CO 2 concentration: North Atlantic Region O, Pacific Region A. (The
dashed line is the nineteenth-century base value: 290 ppm.) Source: Combination of data
from Callender, G. C, Tellus, 10, 243 (1958), and Council on Environmental Quality, "Global
Energy Futures and the Carbon Dioxide Problem." Superintendent of Documents, U.S. Gov-
ernment Printing Office, Washington, DC, 1981. (See also Fig. 11-1.)