
Page 87 - Fundamentals of Air Pollution
P. 87
58 4. Air Quality
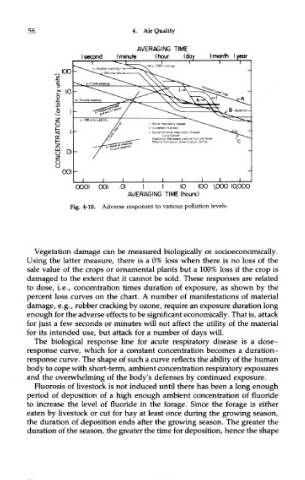
Fig. 4-10. Adverse responses to various pollution levels.
Vegetation damage can be measured biologically or socioeconomically.
Using the latter measure, there is a 0% loss when there is no loss of the
sale value of the crops or ornamental plants but a 100% loss if the crop is
damaged to the extent that it cannot be sold. These responses are related
to dose, i.e., concentration times duration of exposure, as shown by the
percent loss curves on the chart. A number of manifestations of material
damage, e.g., rubber cracking by ozone, require an exposure duration long
enough for the adverse effects to be significant economically. That is, attack
for just a few seconds or minutes will not affect the utility of the material
for its intended use, but attack for a number of days will.
The biological response line for acute respiratory disease is a dose-
response curve, which for a constant concentration becomes a duration-
response curve. The shape of such a curve reflects the ability of the human
body to cope with short-term, ambient concentration respiratory exposures
and the overwhelming of the body's defenses by continued exposure.
Fluorosis of livestock is not induced until there has been a long enough
period of deposition of a high enough ambient concentration of fluoride
to increase the level of fluoride in the forage. Since the forage is either
eaten by livestock or cut for hay at least once during the growing season,
the duration of deposition ends after the growing season. The greater the
duration of the season, the greater the time for deposition, hence the shape