
Page 118 - Fundamentals of Enhanced Oil and Gas Recovery
P. 118
106 Pouria Behnoudfar et al.
Capillary tube CT
RD
B
C
PC
1
Panel light
View cell
CCD camera
Vent
Gas inlet
Pressure & temp. display unit
TL1 TL2
G
4
5
DT PI BT
3
A 1
F E
PI
3
2
2
2
PG1
Support base housing
PG2
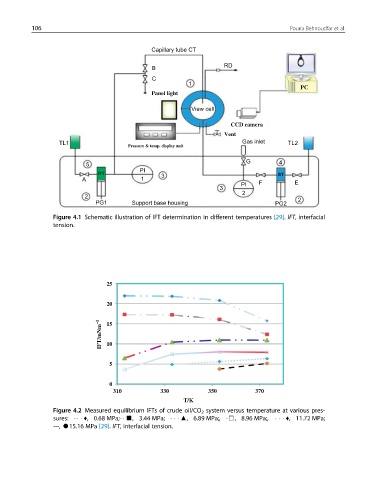
Figure 4.1 Schematic illustration of IFT determination in different temperatures [29]. IFT, interfacial
tension.
25
20
IFT/mNm –1 15
10
5
0
310 330 350 370
T/K
Figure 4.2 Measured equilibrium IFTs of crude oil/CO 2 system versus temperature at various pres-
sures: - V, 0.68 MPa;- ’, 3.44 MPa; - ¢, 6.89 MPa;, -&, 8.96 MPa;, V, 11.72 MPa;
---, K15.16 MPa [29]. IFT, interfacial tension.