
Page 281 - Fundamentals of Enhanced Oil and Gas Recovery
P. 281
CHAPTER NINE
Enhanced Oil Recovery (EOR) in
Shale Oil Reservoirs
Mohammad Ali Ahmadi
Department of Chemical and Petroleum Engineering, University of Calgary, Calgary, AB, Canada
9.1 INTRODUCTION
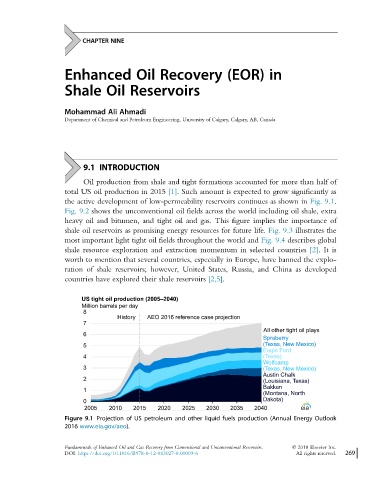
Oil production from shale and tight formations accounted for more than half of
total US oil production in 2015 [1]. Such amount is expected to grow significantly as
the active development of low-permeability reservoirs continues as shown in Fig. 9.1.
Fig. 9.2 shows the unconventional oil fields across the world including oil shale, extra
heavy oil and bitumen, and tight oil and gas. This figure implies the importance of
shale oil reservoirs as promising energy resources for future life. Fig. 9.3 illustrates the
most important light tight oil fields throughout the world and Fig. 9.4 describes global
shale resource exploration and extraction momentum in selected countries [2].Itis
worth to mention that several countries, especially in Europe, have banned the explo-
ration of shale reservoirs; however, United States, Russia, and China as developed
countries have explored their shale reservoirs [2,5].
US tight oil production (2005–2040)
Million barrels per day
8
History AEO 2016 reference case projection
7
All other tight oil plays
6
Spraberry
5 (Texas, New Mexico)
Eagle Ford
4 (Texas)
Wolfcamp
3 (Texas, New Mexico)
Austin Chalk
2 (Louisiana, Texas)
Bakken
1
(Montana, North
0 Dakota)
2005 2010 2015 2020 2025 2030 2035 2040 eia
Figure 9.1 Projection of US petroleum and other liquid fuels production (Annual Energy Outlook
2016 www.eia.gov/aeo).
Fundamentals of Enhanced Oil and Gas Recovery from Conventional and Unconventional Reservoirs. © 2018 Elsevier Inc.
DOI: https://doi.org/10.1016/B978-0-12-813027-8.00009-6 All rights reserved. 269