Page 32 - Fundamentals of Gas Shale Reservoirs
P. 32

12   GAS SHALE: GLOBAL SIGNIFICANCE, DISTRIBUTION, AND CHALLENGES

                                                                                                            1275


                                                                                                          751
                                                                                                      681

                                                                                            485  502 521
                                                                                 388 396 396
                                                                              273
                                                                          231
                                                      138 147 162 172 180 187
                3   11 15 19 20 23 25   42 50  51 63
                                                           Russia
                        Lithuania/Kaliningrad
                                                                                       South Africa
             Morocco Venezuela  Turkey Colombia  UK  Germany Ukraine  Pakistan  India  Scandinavia Argentina/Chile Algeria, Tunisia, Libya  Libya Canada Australia Australia  Argentina  Mexico  USA  China
                                              Other Middle East
                     Morocco, Algeria, Western Sahara, Mauritania                 Paraguay, Brazil, Argentina, Bolivia
                                                                  France
                                                                     Poland


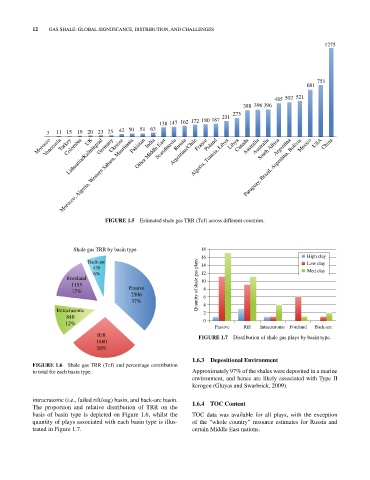
                                    FIGURE 1.5  Estimated shale gas TRR (Tcf) across different countries.


                         Shale gas TRR by basin type                18
                                                                    16                                 High clay
                              Back-arc                                                                 Low clay
                                430                                 14                                 Med clay
                                6%                                  12
                       Foreland                                     10
                         1155               Passive               Quantity of shale gas plays
                         17%                                        8
                                            2506                    6
                                             37%                    4
                    Intracratonic                                   2
                       840
                       12%                                          0
                                                                        Passive   Rift  Intracratonic Foreland  Back-arc
                                 Rift                              FIGURE 1.7  Distribution of shale gas plays by basin type.
                                 1880
                                 28%

                                                                 1.6.3  Depositional Environment
            FIGURE 1.6  Shale gas TRR (Tcf) and percentage contribution
            to total for each basin type.                        Approximately 97% of the shales were deposited in a marine
                                                                 environment, and hence are likely associated with Type II
                                                                 kerogen (Gluyas and Swarbrick, 2009).

            intracratonic (i.e., failed rift/sag) basin, and back‐arc basin.   1.6.4  TOC Content
            The proportion and relative distribution of  TRR on the
            basis of basin type is depicted on Figure  1.6, whilst the   TOC data was available for all plays, with the exception
            quantity of plays associated with each basin type is illus­  of the “whole country” resource estimates for Russia and
            trated in Figure 1.7.                                certain Middle East nations.
   27   28   29   30   31   32   33   34   35   36   37