
Page 13 - Fundamentals of Ocean Renewable Energy Generating Electricity From The Sea
P. 13
Introduction Chapter | 1 5
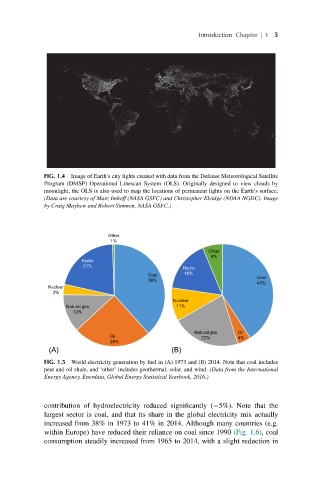
FIG. 1.4 Image of Earth’s city lights created with data from the Defense Meteorological Satellite
Program (DMSP) Operational Linescan System (OLS). Originally designed to view clouds by
moonlight, the OLS is also used to map the locations of permanent lights on the Earth’s surface.
(Data are courtesy of Marc Imhoff (NASA GSFC) and Christopher Elvidge (NOAA NGDC). Image
by Craig Mayhew and Robert Simmon, NASA GSFC.)
Other
1%
Other
6%
Hydro
21%
Hydro
Coal 16%
38% Coal
41%
Nuclear
3%
Nuclear
Natural gas 11%
12%
Natural gas Oil
Oil 22% 4%
25%
(A) (B)
FIG. 1.5 World electricity generation by fuel in (A) 1973 and (B) 2014. Note that coal includes
peat and oil shale, and ‘other’ includes geothermal, solar, and wind. (Data from the International
Energy Agency. Enerdata, Global Energy Statistical Yearbook, 2016.)
contribution of hydroelectricity reduced significantly (−5%). Note that the
largest sector is coal, and that its share in the global electricity mix actually
increased from 38% in 1973 to 41% in 2014. Although many countries (e.g.
within Europe) have reduced their reliance on coal since 1990 (Fig. 1.6), coal
consumption steadily increased from 1965 to 2014, with a slight reduction in