
Page 154 - Fundamentals of Ocean Renewable Energy Generating Electricity From The Sea
P. 154
144 Fundamentals of Ocean Renewable Energy
Midshelf deployment Offshore deployment
0 0
−10 min 75% mean 15% max −25 min 75% mean 15% max
−20 −50
−30 −75
−40 −100
Depth (m) −50 −125
−60 −150
−70 −175
−80 −200
Max current speed
15% exceedance
−90 −225 Mean
75% exceedance
Min
−100 −250
0 0.5 1 1.5 2 2.5 3 0 0.5 1 1.5 2 2.5 3
Velocity (m/s)
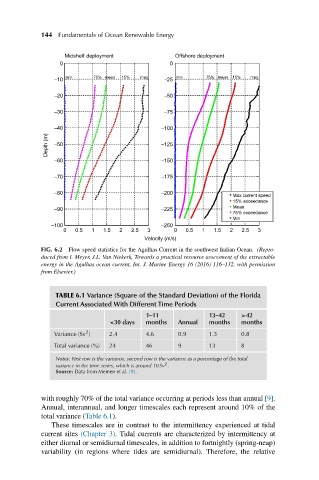
FIG. 6.2 Flow speed statistics for the Agulhas Current in the southwest Indian Ocean. (Repro-
duced from I. Meyer, J.L. Van Niekerk, Towards a practical resource assessment of the extractable
energy in the Agulhas ocean current, Int. J. Marine Energy 16 (2016) 116–132, with permission
from Elsevier.)
TABLE 6.1 Variance (Square of the Standard Deviation) of the Florida
Current Associated With Different Time Periods
1–11 13–42 >42
<30 days months Annual months months
2
Variance (Sv ) 2.4 4.6 0.9 1.3 0.8
Total variance (%) 24 46 9 13 8
Notes: First row is the variance, second row is the variance as a percentage of the total
2
variance in the time series, which is around 10 Sv .
Source: Data from Meinen et al. [9].
with roughly 70% of the total variance occurring at periods less than annual [9].
Annual, interannual, and longer timescales each represent around 10% of the
total variance (Table 6.1).
These timescales are in contrast to the intermittency experienced at tidal
current sites (Chapter 3). Tidal currents are characterized by intermittency at
either diurnal or semidiurnal timescales, in addition to fortnightly (spring-neap)
variability (in regions where tides are semidiurnal). Therefore, the relative