
Page 60 - Fundamentals of Ocean Renewable Energy Generating Electricity From The Sea
P. 60
52 Fundamentals of Ocean Renewable Energy
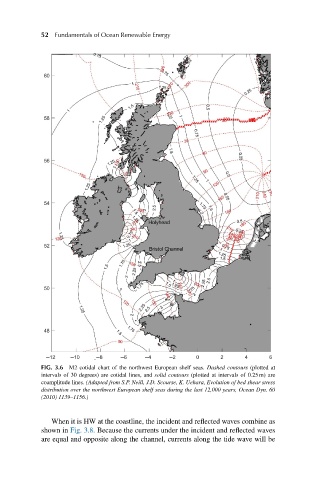
FIG. 3.6 M2 cotidal chart of the northwest European shelf seas. Dashed contours (plotted at
intervals of 30 degrees) are cotidal lines, and solid contours (plotted at intervals of 0.25 m) are
coamplitude lines. (Adapted from S.P. Neill, J.D. Scourse, K. Uehara, Evolution of bed shear stress
distribution over the northwest European shelf seas during the last 12,000 years, Ocean Dyn. 60
(2010) 1139–1156.)
When it is HW at the coastline, the incident and reflected waves combine as
shown in Fig. 3.8. Because the currents under the incident and reflected waves
are equal and opposite along the channel, currents along the tide wave will be