
Page 256 - Fundamentals of Probability and Statistics for Engineers
P. 256
Some Important Continuous Distributions 239
Arkin, H., and Colton, R.1963, Tablesfor Statisticians, 2nd edn., Barnesand Noble, NewYork.
Beyer, W.H., 1996, Handbook of Tables for Probability and Statistics, Chemical Rubber
Co., Cleveland, OH.
Hald, A., 1952, Statistical Tables and Formulas, John Wiley & Sons Inc. New York.
Owen, D., 1962, Handbook of Statistical Tables, Addision-Wesley, Reading,
Pearson, E.S., and Harley, H.O. (eds) 1954, Biometrika Tables for Statisticians, Volume 1,
Cambridge University Press, Cambridge, England.
Additional useful references include:
Aitchison, J., and Brown, J.A.C., 1957, The Log-normal Distribution, Cambridge
University Press, Cambridge, England.
Harter, H.L., 1964, New Tables of the Incomplete Gamma Function Ratio and of Per-
centage Points of the Chi-square and Beta Distributions, Aerospace Laboratory; US
Government Printing office, Washington, DC.
National Bureau of Standards, 1954, Tables of the Bivariate Normal Distribution and
Related Functions: Applied Mathematics Series 50, US Government Printing office,
Washington, DC.
PROBLEMS
7.1 The random variables X and Y are independent and uniformly distributed in
interval (0.1). Determine the probability that their product XY is less than 1/2.
7.2 The characteristic function (CF) of a random variable X uniformly distributed in the
interval ( 1, 1) is
sin t
X
t :
t
(a) Find the CF of Y , that is uniformly distributed in interval ( a, a).
(b) Find the CF of Y if it is uniformly distributed in interval (a, a b).
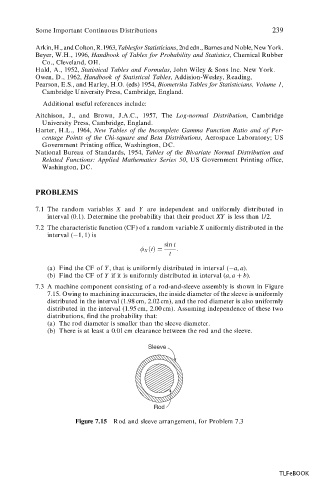
7.3 A machine component consisting of a rod-and-sleeve assembly is shown in Figure
7.15. Owing to machining inaccuracies, the inside diameter of the sleeve is uniformly
distributed in the interval (1.98 cm, 2.02 cm), and the rod diameter is also uniformly
distributed in the interval (1.95 cm, 2.00 cm). Assuming independence of these two
distributions, find the probability that:
(a) The rod diameter is smaller than the sleeve diameter.
(b) There is at least a 0.01 cm clearance between the rod and the sleeve.
Sleeve
Rod
Figure 7.15 Rod and sleeve arrangement, for Problem 7.3
TLFeBOOK