
Page 368 - Fundamentals of Radar Signal Processing
P. 368
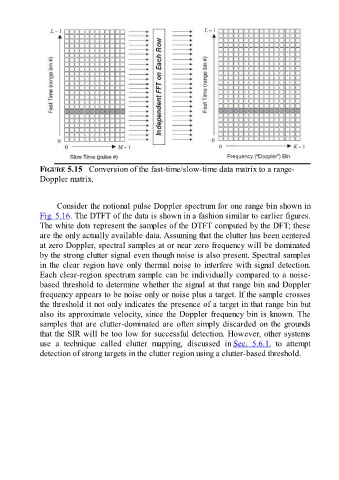
FIGURE 5.15   Conversion of the fast-time/slow-time data matrix to a range-
               Doppler matrix.


                     Consider the notional pulse Doppler spectrum for one range bin shown in

               Fig. 5.16. The DTFT of the data is shown in a fashion similar to earlier figures.
               The white dots represent the samples of the DTFT computed by the DFT; these
               are the only actually available data. Assuming that the clutter has been centered
               at zero Doppler, spectral samples at or near zero frequency will be dominated
               by the strong clutter signal even though noise is also present. Spectral samples
               in the clear region have only thermal noise to interfere with signal detection.

               Each clear-region spectrum sample can be individually compared to a noise-
               based threshold to determine whether the signal at that range bin and Doppler
               frequency appears to be noise only or noise plus a target. If the sample crosses
               the threshold it not only indicates the presence of a target in that range bin but
               also its approximate velocity, since the Doppler frequency bin is known. The
               samples that are clutter-dominated are often simply discarded on the grounds
               that the SIR will be too low for successful detection. However, other systems

               use  a  technique  called  clutter  mapping,  discussed  in Sec.  5.6.1,  to  attempt
               detection of strong targets in the clutter region using a clutter-based threshold.