
Page 498 - Fundamentals of Radar Signal Processing
P. 498
(6.123)
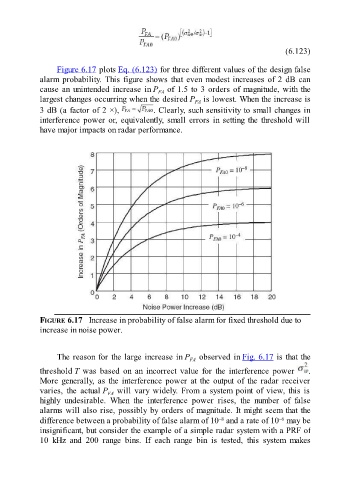
Figure 6.17 plots Eq. (6.123) for three different values of the design false
alarm probability. This figure shows that even modest increases of 2 dB can
cause an unintended increase in P of 1.5 to 3 orders of magnitude, with the
FA
largest changes occurring when the desired P is lowest. When the increase is
FA
3 dB (a factor of 2 ×), . Clearly, such sensitivity to small changes in
interference power or, equivalently, small errors in setting the threshold will
have major impacts on radar performance.
FIGURE 6.17 Increase in probability of false alarm for fixed threshold due to
increase in noise power.
The reason for the large increase in P observed in Fig. 6.17 is that the
FA
threshold T was based on an incorrect value for the interference power .
More generally, as the interference power at the output of the radar receiver
varies, the actual P will vary widely. From a system point of view, this is
FA
highly undesirable. When the interference power rises, the number of false
alarms will also rise, possibly by orders of magnitude. It might seem that the
–8
–6
difference between a probability of false alarm of 10 and a rate of 10 may be
insignificant, but consider the example of a simple radar system with a PRF of
10 kHz and 200 range bins. If each range bin is tested, this system makes