
Page 246 - Fundamentals of Reservoir Engineering
P. 246
OILWELL TESTING 184
very short or very long flowing times equ. (7.42) reduces to equ. (7.23) and (7.27)
respectively, which can be verified by using the argument used to derive equ. (7.43)
and (7.44) in reverse, i.e. by evaluating p D(MBH) in equ. (7.42) as being equal to 4πt DA
and In (C A t DA), respectively.
The relative ease with which p D functions can be generated using the MBH charts is
illustrated in the following exercise which is an extension of exercise 7.2.
EXERCISE 7.5 GENERATION OF DIMENSIONLESS PRESSURE FUNCTIONS
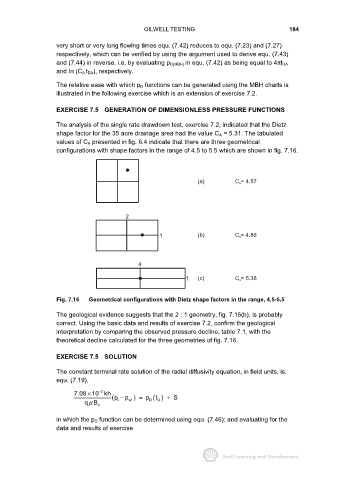
The analysis of the single rate drawdown test, exercise 7.2, indicated that the Dietz
shape factor for the 35 acre drainage area had the value C A = 5.31. The tabulated
values of C A presented in fig. 6.4 indicate that there are three geometrical
configurations with shape factors in the range of 4.5 to 5.5 which are shown in fig. 7.16.
(a) C = 4.57
A
2
1 (b) C = 4.86
A
4
1 (c) C = 5.38
A
Fig. 7.16 Geometrical configurations with Dietz shape factors in the range, 4.5-5.5
The geological evidence suggests that the 2 : 1 geometry, fig. 7.16(b), is probably
correct. Using the basic data and results of exercise 7.2, confirm the geological
interpretation by comparing the observed pressure decline, table 7.1, with the
theoretical decline calculated for the three geometries of fig. 7.16.
EXERCISE 7.5 SOLUTION
The constant terminal rate solution of the radial diffusivity equation, in field units, is,
equ. (7.19),
3
7.08 10 kh p p t S
−
×
i
D
qB o (p − wf ) = D ( ) +
µ
in which the p D function can be determined using equ. (7.46); and evaluating for the
data and results of exercise