
Page 359 - Fundamentals of Reservoir Engineering
P. 359
REAL GAS FLOW: GAS WELL TESTING 294
BASIC
INPUT
PVT
PRELIMINARY
ANALYSIS
KAZEMI DIGITIZED
ITERATION MBH CHARTS
SPECIAL
ANALYSES
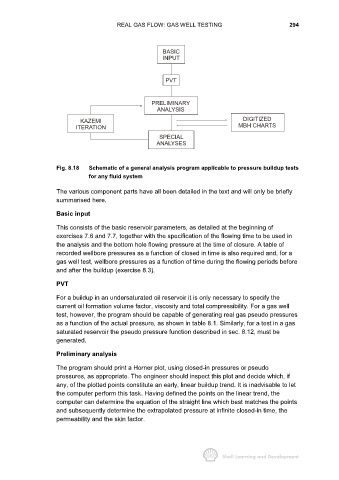
Fig. 8.18 Schematic of a general analysis program applicable to pressure buildup tests
for any fluid system
The various component parts have all been detailed in the text and will only be briefly
summarised here.
Basic input
This consists of the basic reservoir parameters, as detailed at the beginning of
exercises 7.6 and 7.7, together with the specification of the flowing time to be used in
the analysis and the bottom hole flowing pressure at the time of closure. A table of
recorded wellbore pressures as a function of closed in time is also required and, for a
gas well test, wellbore pressures as a function of time during the flowing periods before
and after the buildup (exercise 8.3).
PVT
For a buildup in an undersaturated oil reservoir it is only necessary to specify the
current oil formation volume factor, viscosity and total compressibility. For a gas well
test, however, the program should be capable of generating real gas pseudo pressures
as a function of the actual pressure, as shown in table 8.1. Similarly, for a test in a gas
saturated reservoir the pseudo pressure function described in sec. 8.12, must be
generated.
Preliminary analysis
The program should print a Horner plot, using closed-in pressures or pseudo
pressures, as appropriate. The engineer should inspect this plot and decide which, if
any, of the plotted points constitute an early, linear buildup trend. It is inadvisable to let
the computer perform this task. Having defined the points on the linear trend, the
computer can determine the equation of the straight line which best matches the points
and subsequently determine the extrapolated pressure at infinite closed-in time, the
permeability and the skin factor.