
Page 79 - Geology of Carbonate Reservoirs
P. 79
60 PETROPHYSICAL PROPERTIES OF CARBONATE RESERVOIRS
for carbonate reservoirs with a high percentage of separate vug porosity, according
to Focke and Munn (1987) and Lucia (1983) . Archie m and a values are related to
pore characteristics and may vary in different kinds of reservoir rocks. Because the
tortuosity factor, a , is not related exponentially to F , and because it has a relatively
narrow range of variation around 1.0 for most carbonate reservoirs, it does not have
as much impact on S w calculations as does m . This fact is addressed in Lucia ’ s (1983)
porosity classification where the amount of separate vug porosity is compared with
m values (Figure 3.4 ). Focke and Munn (1987) recognized that “ the porosity type is
by far the most important parameter in regard to reservoir properties. Archie ’ s own
carbonate rock classification, although very useful in wellsite geology, does not include
a genetic porosity classification and therefore is not adequate in the study of reservoir
properties. ”
A
1
Harmattan Dolomite
Separate vug porosity Total porosity 0.5 Quitman
Bryans Mill Dolomite, average values
Snipe Lake
Magnolia
0
1.8 2.0 2.2 2.4 2.6 2.8 3.0
Measured m values vs separate vug/total porosity ratio
B
Black dots represent moldic porosity
1
10 15 20
Separate vug porosity % Total porosity 0.5 25 30 35
Total
0 porosity
2 2.5 3 3.5 4 4.5
m Values
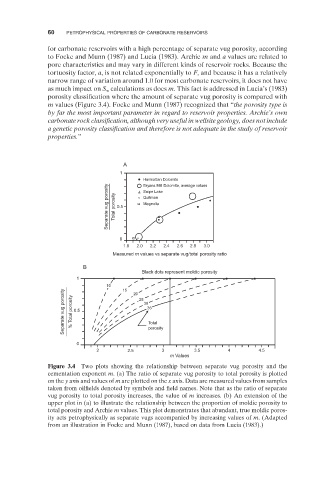
Figure 3.4 Two plots showing the relationship between separate vug porosity and the
cementation exponent m . (a) The ratio of separate vug porosity to total porosity is plotted
on the y axis and values of m are plotted on the x axis. Data are measured values from samples
taken from oilfields denoted by symbols and field names. Note that as the ratio of separate
vug porosity to total porosity increases, the value of m increases. (b) An extension of the
upper plot in (a) to illustrate the relationship between the proportion of moldic porosity to
total porosity and Archie m values. This plot demonstrates that abundant, true moldic poros-
ity acts petrophysically as separate vugs accompanied by increasing values of m . (Adapted
from an illustration in Focke and Munn (1987) , based on data from Lucia (1983) .)