
Page 165 - Geotechnical Engineering Soil and Foundation Principles and Practice
P. 165
Particle Size and Gradation
160 Geotechnical Engineering
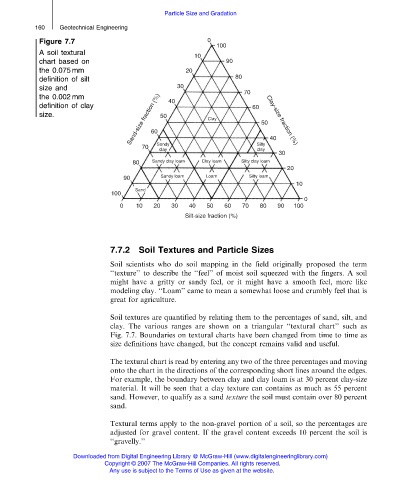
Figure 7.7
A soil textural
chart based on
the 0.075 mm
definition of silt
size and
the 0.002 mm
definition of clay
size.
7.7.2 Soil Textures and Particle Sizes
Soil scientists who do soil mapping in the field originally proposed the term
‘‘texture’’ to describe the ‘‘feel’’ of moist soil squeezed with the fingers. A soil
might have a gritty or sandy feel, or it might have a smooth feel, more like
modeling clay. ‘‘Loam’’ came to mean a somewhat loose and crumbly feel that is
great for agriculture.
Soil textures are quantified by relating them to the percentages of sand, silt, and
clay. The various ranges are shown on a triangular ‘‘textural chart’’ such as
Fig. 7.7. Boundaries on textural charts have been changed from time to time as
size definitions have changed, but the concept remains valid and useful.
The textural chart is read by entering any two of the three percentages and moving
onto the chart in the directions of the corresponding short lines around the edges.
For example, the boundary between clay and clay loam is at 30 percent clay-size
material. It will be seen that a clay texture can contains as much as 55 percent
sand. However, to qualify as a sand texture the soil must contain over 80 percent
sand.
Textural terms apply to the non-gravel portion of a soil, so the percentages are
adjusted for gravel content. If the gravel content exceeds 10 percent the soil is
‘‘gravelly.’’
Downloaded from Digital Engineering Library @ McGraw-Hill (www.digitalengineeringlibrary.com)
Copyright © 2007 The McGraw-Hill Companies. All rights reserved.
Any use is subject to the Terms of Use as given at the website.