
Page 287 - Geotechnical Engineering Soil and Foundation Principles and Practice
P. 287
Compaction
282 Geotechnical Engineering
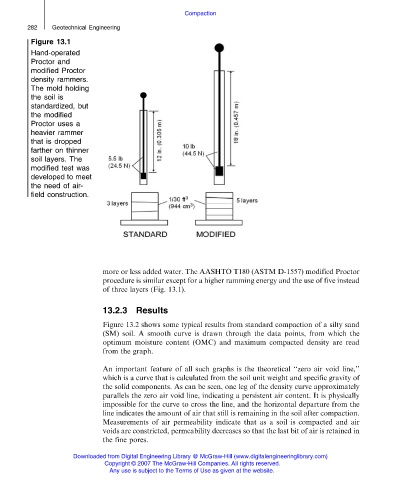
Figure 13.1
Hand-operated
Proctor and
modified Proctor
density rammers.
The mold holding
the soil is
standardized, but
the modified
Proctor uses a
heavier rammer
that is dropped
farther on thinner
soil layers. The
modified test was
developed to meet
the need of air-
field construction.
more or less added water. The AASHTO T180 (ASTM D-1557) modified Proctor
procedure is similar except for a higher ramming energy and the use of five instead
of three layers (Fig. 13.1).
13.2.3 Results
Figure 13.2 shows some typical results from standard compaction of a silty sand
(SM) soil. A smooth curve is drawn through the data points, from which the
optimum moisture content (OMC) and maximum compacted density are read
from the graph.
An important feature of all such graphs is the theoretical ‘‘zero air void line,’’
which is a curve that is calculated from the soil unit weight and specific gravity of
the solid components. As can be seen, one leg of the density curve approximately
parallels the zero air void line, indicating a persistent air content. It is physically
impossible for the curve to cross the line, and the horizontal departure from the
line indicates the amount of air that still is remaining in the soil after compaction.
Measurements of air permeability indicate that as a soil is compacted and air
voids are constricted, permeability decreases so that the last bit of air is retained in
the fine pores.
Downloaded from Digital Engineering Library @ McGraw-Hill (www.digitalengineeringlibrary.com)
Copyright © 2007 The McGraw-Hill Companies. All rights reserved.
Any use is subject to the Terms of Use as given at the website.