
Page 246 - Geothermal Energy Systems Exploration, Development, and Utilization
P. 246
222 4 Enhancing Geothermal Reservoirs
OPS4
0 4550 EPS1
4601
4616
500
1000
1500
2000 GPK1
True vertical depth (m) 3000
2500
3500
4000
4500
5000
GPK2 GPK3 GPK4
5500
1000
0
−1000
0 −1000 −2000
Easting (m)
Northing (m)
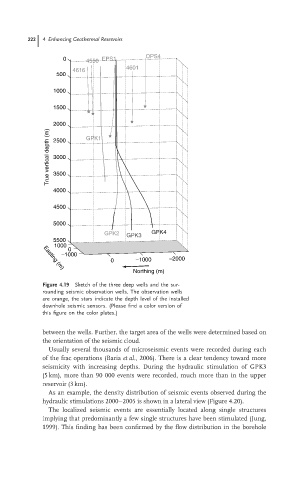
Figure 4.19 Sketch of the three deep wells and the sur-
rounding seismic observation wells. The observation wells
are orange, the stars indicate the depth level of the installed
downhole seismic sensors. (Please find a color version of
this figure on the color plates.)
between the wells. Further, the target area of the wells were determined based on
the orientation of the seismic cloud.
Usually several thousands of microseismic events were recorded during each
of the frac operations (Baria et al., 2006). There is a clear tendency toward more
seismicity with increasing depths. During the hydraulic stimulation of GPK3
(5 km), more than 90 000 events were recorded, much more than in the upper
reservoir (3 km).
As an example, the density distribution of seismic events observed during the
hydraulic stimulations 2000–2005 is shown in a lateral view (Figure 4.20).
The localized seismic events are essentially located along single structures
implying that predominantly a few single structures have been stimulated (Jung,
1999). This finding has been confirmed by the flow distribution in the borehole