
Page 81 - Geothermal Energy Systems Exploration, Development, and Utilization
P. 81
2.4 Geophysics 57
E
x H
Electric
dipoles
Magnetic coils
y
z
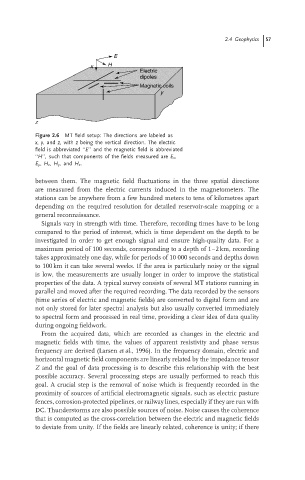
Figure 2.6 MT field setup: The directions are labeled as
x, y,and z,with z being the vertical direction. The electric
field is abbreviated ‘‘E’’ and the magnetic field is abbreviated
‘‘H’’, such that components of the fields measured are E x ,
E y , H x , H y ,and H z .
between them. The magnetic field fluctuations in the three spatial directions
are measured from the electric currents induced in the magnetometers. The
stations can be anywhere from a few hundred meters to tens of kilometres apart
depending on the required resolution for detailed reservoir-scale mapping or a
general reconnaissance.
Signals vary in strength with time. Therefore, recording times have to be long
compared to the period of interest, which is time dependent on the depth to be
investigated in order to get enough signal and ensure high-quality data. For a
maximum period of 100 seconds, corresponding to a depth of 1–2 km, recording
takes approximately one day, while for periods of 10 000 seconds and depths down
to 100 km it can take several weeks. If the area is particularly noisy or the signal
is low, the measurements are usually longer in order to improve the statistical
properties of the data. A typical survey consists of several MT stations running in
parallel and moved after the required recording. The data recorded by the sensors
(time series of electric and magnetic fields) are converted to digital form and are
not only stored for later spectral analysis but also usually converted immediately
to spectral form and processed in real time, providing a clear idea of data quality
during ongoing fieldwork.
From the acquired data, which are recorded as changes in the electric and
magnetic fields with time, the values of apparent resistivity and phase versus
frequency are derived (Larsen et al., 1996). In the frequency domain, electric and
horizontal magnetic field components are linearly related by the impedance tensor
Z and the goal of data processing is to describe this relationship with the best
possible accuracy. Several processing steps are usually performed to reach this
goal. A crucial step is the removal of noise which is frequently recorded in the
proximity of sources of artificial electromagnetic signals, such as electric pasture
fences, corrosion-protected pipelines, or railway lines, especially if they are run with
DC. Thunderstorms are also possible sources of noise. Noise causes the coherence
that is computed as the cross-correlation between the electric and magnetic fields
to deviate from unity. If the fields are linearly related, coherence is unity; if there